Technical Analysis
50 Advanced Chart Patterns for Stock Market Technical Analysis
Chart patterns are recurring arrangements of price swings that technical analysts use to describe trend, consolidation, and possible changes in supply and demand. Stock market chart patterns are read from price charts over a chosen timeframe; their meaning depends on the candles, context, and levels around them, not just a familiar outline. Reversal patterns may suggest that an existing move is losing strength, while continuation patterns describe a pause that could resolve with the prior trend. Bullish and bearish labels describe a possible directional interpretation, not a promise. Triangles, wedges, flags, and pennants organize converging or brief consolidations; harmonic patterns use measured swing relationships. This guide covers 50 advanced examples, with formation clues, confirmation ideas, and limitations. Some illustrations are schematic; most chart examples are historical, delayed NSE candidates and are not visually verified. Patterns are analytical tools, and no formation guarantees future price movement.
Quick answer
Chart patterns describe recurring price formations and suggest possible continuation or reversal scenarios; they do not guarantee future outcomes. Common examples include Head and Shoulders, Inverse Head and Shoulders, Double Top, Double Bottom, Triple Top, Triple Bottom, Ascending Triangle, Descending Triangle, Symmetrical Triangle, Bull Flag, Bear Flag, Pennant, Cup and Handle, Rising Wedge, Falling Wedge, Rectangle, Rounding Bottom, and Rounding Top. Traders look for confirmation from candles, volume, support, resistance, RSI, moving averages, VWAP, and breakout levels. Timeframes matter, and false breakouts and failed patterns are possible. Treat patterns as a research framework, not guaranteed trading signals on their own.
Table of contents
At a glance
Quick Pattern Reference
These are common textbook interpretations, not predictions. Confirm the boundary and market context before drawing a conclusion.
| Pattern | Category | Common interpretation | Typical context |
|---|---|---|---|
| Head and Shoulders | Reversal | Often bearish | After an advance; neckline is support |
| Inverse Head and Shoulders | Reversal | Often bullish | After a decline; neckline is resistance |
| Double Top | Reversal | Often bearish | Two tests near resistance |
| Double Bottom | Reversal | Often bullish | Two tests near support |
| Triple Top | Reversal | Often bearish | Repeated resistance tests |
| Triple Bottom | Reversal | Often bullish | Repeated support tests |
| Ascending Triangle | Triangle | Often bullish; not assured | Rising lows beneath resistance |
| Descending Triangle | Triangle | Often bearish; not assured | Lower highs above support |
| Symmetrical Triangle | Triangle | Direction depends on the break | Contracting range |
| Bull Flag | Continuation | Often bullish | Compact pause after an advance |
| Bear Flag | Continuation | Often bearish | Compact pause after a decline |
| Bullish Pennant | Continuation | Often bullish | Small contraction after an advance |
| Bearish Pennant | Continuation | Often bearish | Small contraction after a decline |
| Cup and Handle | Continuation | Often bullish | Rounded base and smaller handle |
| Inverse Cup and Handle | Continuation | Often bearish | Rounded decline and smaller pause |
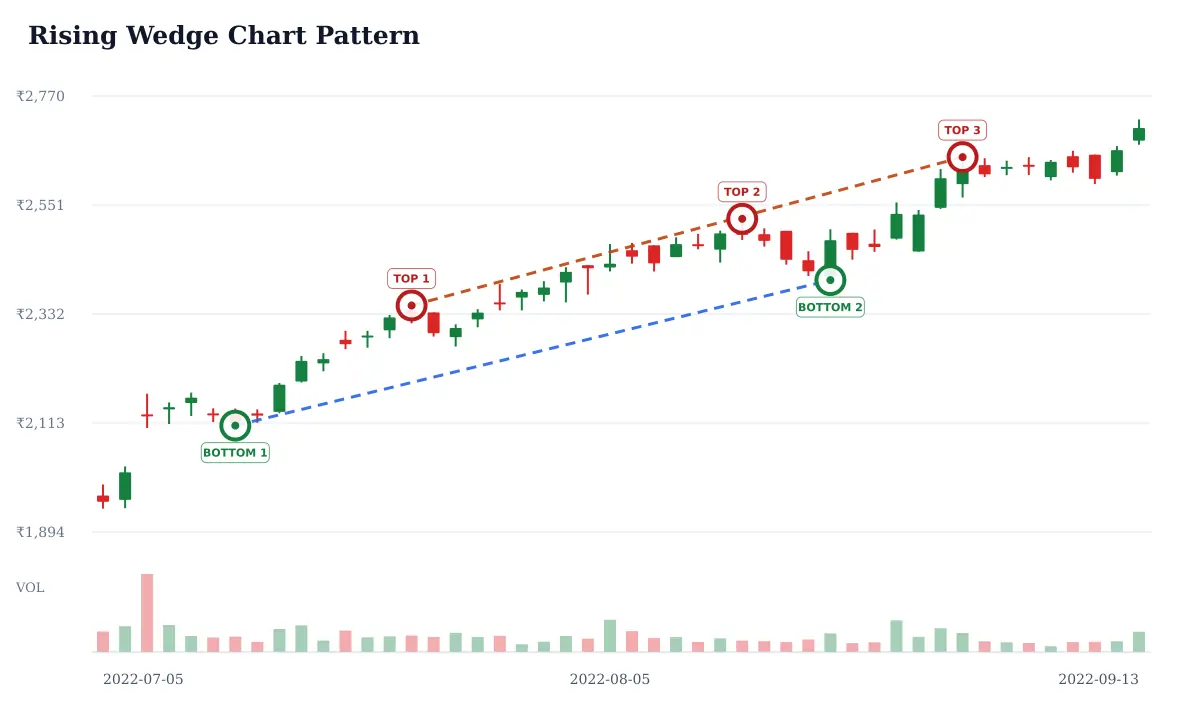
| Rising Wedge | Wedge | Often bearish; context matters | Converging boundaries rising |
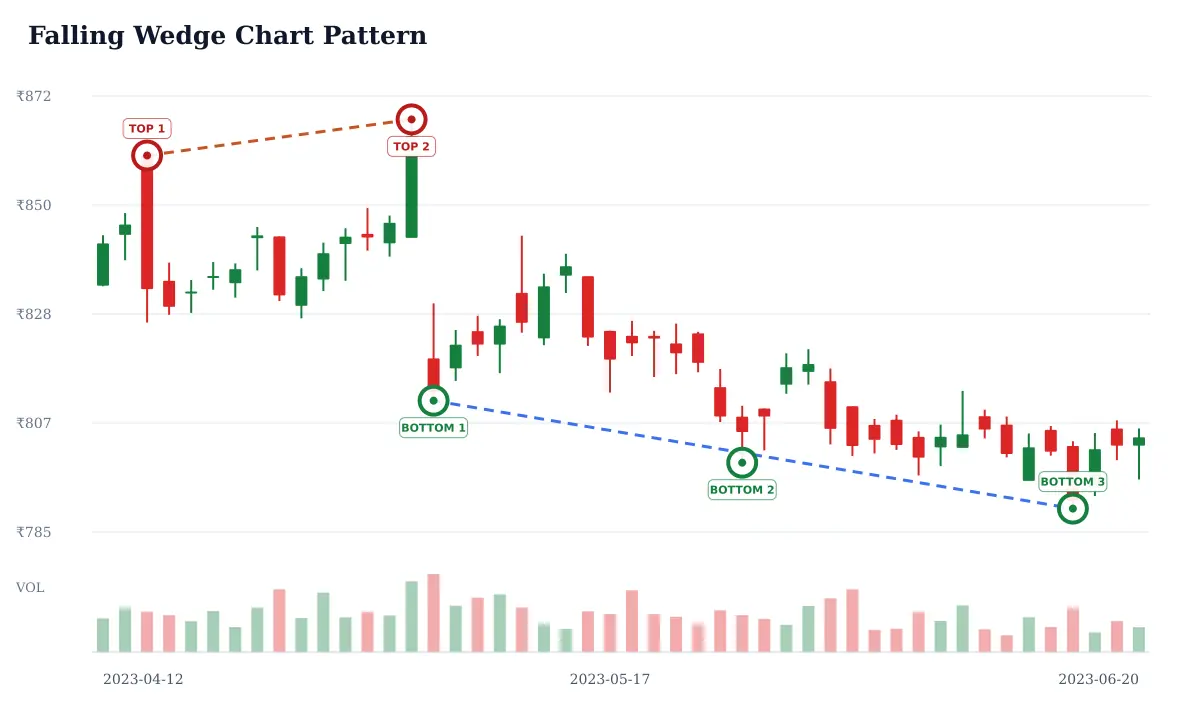
| Falling Wedge | Wedge | Often bullish; context matters | Converging boundaries falling |
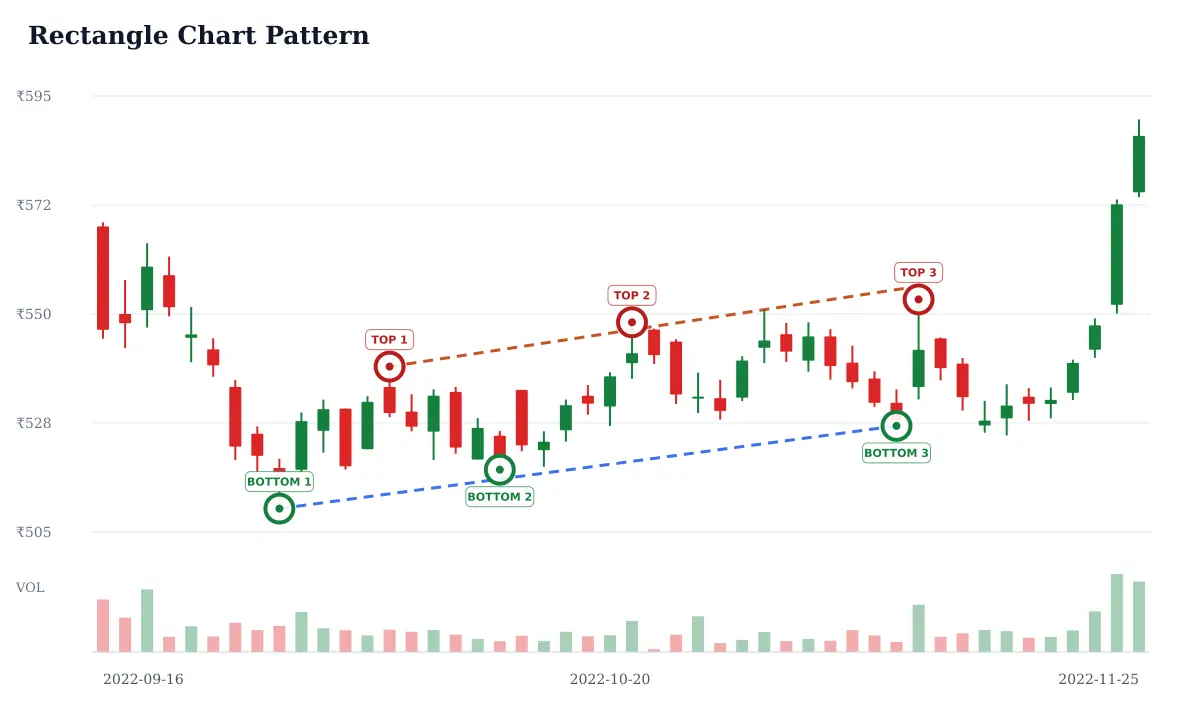
| Rectangle | Range | Neutral until a boundary breaks | Repeated horizontal reactions |
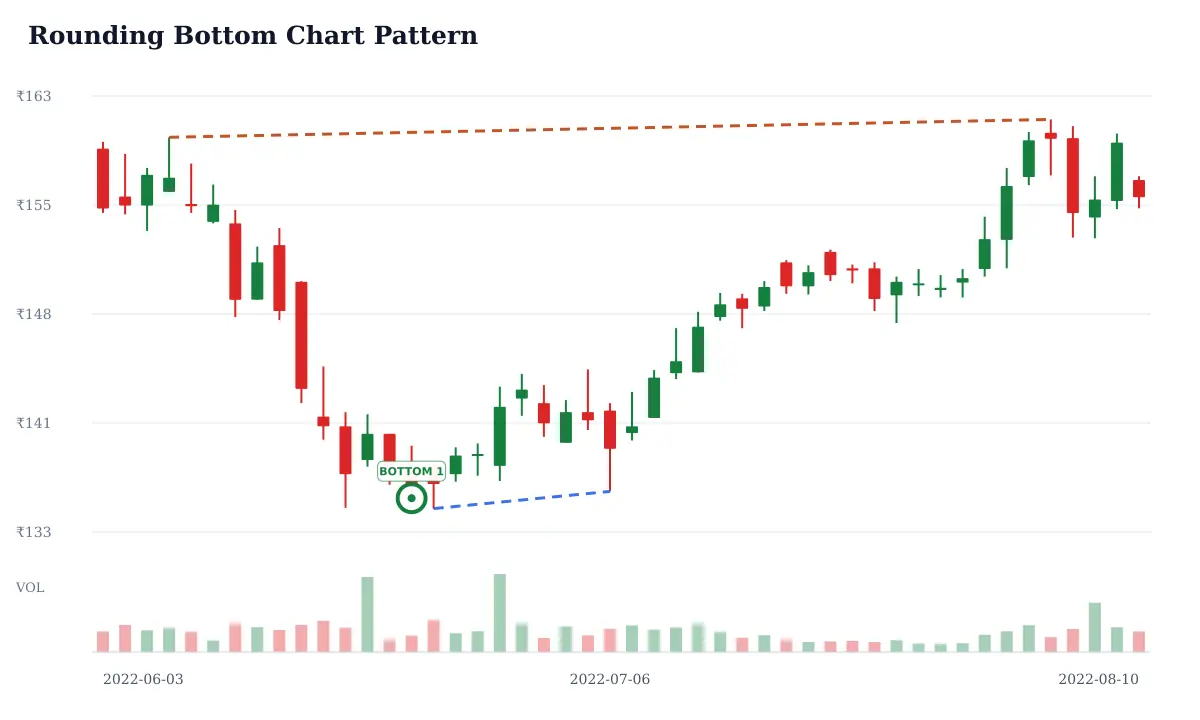
| Rounding Bottom | Reversal | Potentially bullish | Gradual base after a decline |
| Rounding Top | Reversal | Potentially bearish | Gradual loss of an advance |
| Broadening Formation | Price structure | Direction is uncertain | Swing highs and lows expand |
| Broadening Ascending Wedge | Price structure | May warn of downside risk | Widening swings in a rising structure |
| Broadening Descending Wedge | Price structure | May precede a rebound | Widening swings in a falling structure |
| Diamond Top | Reversal | Often bearish after confirmation | Expansion then contraction near a high |
| Diamond Bottom | Reversal | Potentially bullish after confirmation | Expansion then contraction near a low |
| Channel Up | Price structure | Describes an upward trend | Rising parallel boundaries |
| Channel Down | Price structure | Describes a downward trend | Falling parallel boundaries |
| Horizontal Channel | Range | Neutral inside the range | Repeated horizontal support and resistance |
| Bullish Megaphone | Price structure | Potentially bullish after a break | Widening swings near a possible low |
| Bearish Megaphone | Price structure | Potentially bearish after a break | Widening swings near a possible high |
| Bullish AB=CD | Harmonic | Potentially bullish at D | Approximate equality of AB and CD |
| Bearish AB=CD | Harmonic | Potentially bearish at D | Approximate equality of AB and CD |
| Bullish Gartley | Harmonic | Potentially bullish at the PRZ | X-A-B-C-D ratio sequence |
| Bearish Gartley | Harmonic | Potentially bearish at the PRZ | Mirrored X-A-B-C-D ratio sequence |
| Bullish Bat | Harmonic | Potentially bullish at the PRZ | Deep measured retracement |
| Bearish Bat | Harmonic | Potentially bearish at the PRZ | Mirrored deep retracement |
| Bullish Butterfly | Harmonic | Potentially bullish at the PRZ | Final swing may extend beyond A |
| Bearish Butterfly | Harmonic | Potentially bearish at the PRZ | Mirrored extension beyond A |
| Bullish Crab | Harmonic | Potentially bullish at the PRZ | Deep final extension |
| Bearish Crab | Harmonic | Potentially bearish at the PRZ | Mirrored deep final extension |
| Bullish Cypher | Harmonic | Potentially bullish at the PRZ | C extends beyond X; D retraces XC |
| Bearish Cypher | Harmonic | Potentially bearish at the PRZ | Mirrored extension and retracement |
| Bullish Shark | Harmonic | Potentially bullish after a response | Extended swings; conventions vary |
| Bearish Shark | Harmonic | Potentially bearish after a response | Mirrored extended swings |
| Bullish 1-2-3 Reversal | Reversal | Potentially bullish above point 2 | Higher low after a decline |
| Bearish 1-2-3 Reversal | Reversal | Potentially bearish below point 2 | Lower high after an advance |
| Bullish Wolfe Wave | Price structure | Potentially bullish after rejection | Five alternating pivots in decline |
| Bearish Wolfe Wave | Price structure | Potentially bearish after rejection | Five alternating pivots in advance |
| V-Bottom Reversal | Reversal | Potentially bullish after confirmation | Sharp decline followed by rebound |
| V-Top Reversal | Reversal | Potentially bearish after confirmation | Sharp rise followed by decline |
What Are Chart Patterns?
A chart pattern is a recurring arrangement of price swings that helps describe how buyers and sellers have behaved over a chosen period. Analysts use the shape to frame a question about trend, consolidation, support or resistance; it is not evidence by itself that price must move in a particular direction. The same outline can mean different things on different timeframes or in different market conditions.
How Chart Patterns Work in Technical Analysis
Patterns are built from completed price bars and their swing highs, swing lows, ranges and reaction levels. A neckline, trendline or range boundary gives the analyst a level to monitor. A close beyond that boundary may support a breakout or breakdown interpretation, while a move back inside can indicate a failed break. Volume, liquidity, the broader trend and nearby support or resistance add context, but none removes uncertainty.
Types of Stock Market Chart Patterns
Pattern names group different kinds of price structure. Reversal and continuation describe the question being studied; triangles, wedges, flags, pennants, ranges and harmonic formations describe shapes or measurement conventions. Bullish and bearish labels refer to a possible interpretation, not a guaranteed outcome. A pattern's context and confirmation matter more than its label.
Reversal Chart Patterns
A reversal pattern may indicate that an established advance or decline is losing momentum. It remains a candidate until price confirms a change in structure; a move against the proposed reversal can invalidate it.
Continuation Chart Patterns
A continuation pattern describes a pause or contraction within a prior move. The earlier trend supplies context, but a breakout in either direction is possible and needs its own confirmation.
Triangle Chart Patterns
Triangles form as swing boundaries converge. An ascending or descending triangle has one comparatively flat boundary; a symmetrical triangle has pressure from both sides. The eventual direction cannot be assumed from the outline alone.
Wedge Chart Patterns
Wedges have converging, usually sloped boundaries. Their interpretation depends on where they form and which boundary price leaves; rising and falling wedges can fail or resolve contrary to a common textbook reading.
Flag and Pennant Patterns
Flags and pennants are compact pauses that follow a sharp price move. The pole provides context, while a close beyond the consolidation boundary is one possible continuation clue. A deep retracement or break the other way challenges that reading.
Price Structure Patterns
Channels, ranges, rounding formations, broadening structures and diamonds describe how swings are organized over time. They help mark boundaries and changing volatility, but visual similarity alone does not establish a reliable setup.
Harmonic Chart Patterns
Harmonic patterns use named swing points and Fibonacci ratio conventions to define a potential completion zone. AB=CD, Gartley, Bat, Butterfly, Crab, Cypher and Shark definitions vary between references; state the convention used and wait for a price response rather than treating a ratio match as confirmation.
50 Advanced Chart Patterns Explained
The 50 entries below combine reversal, continuation, triangle, wedge, price-structure and harmonic examples. Each entry describes the formation and a possible confirmation or invalidation clue. Historical chart examples are research illustrations of past price data, not forecasts or verified pattern classifications.
Head and Shoulders Pattern
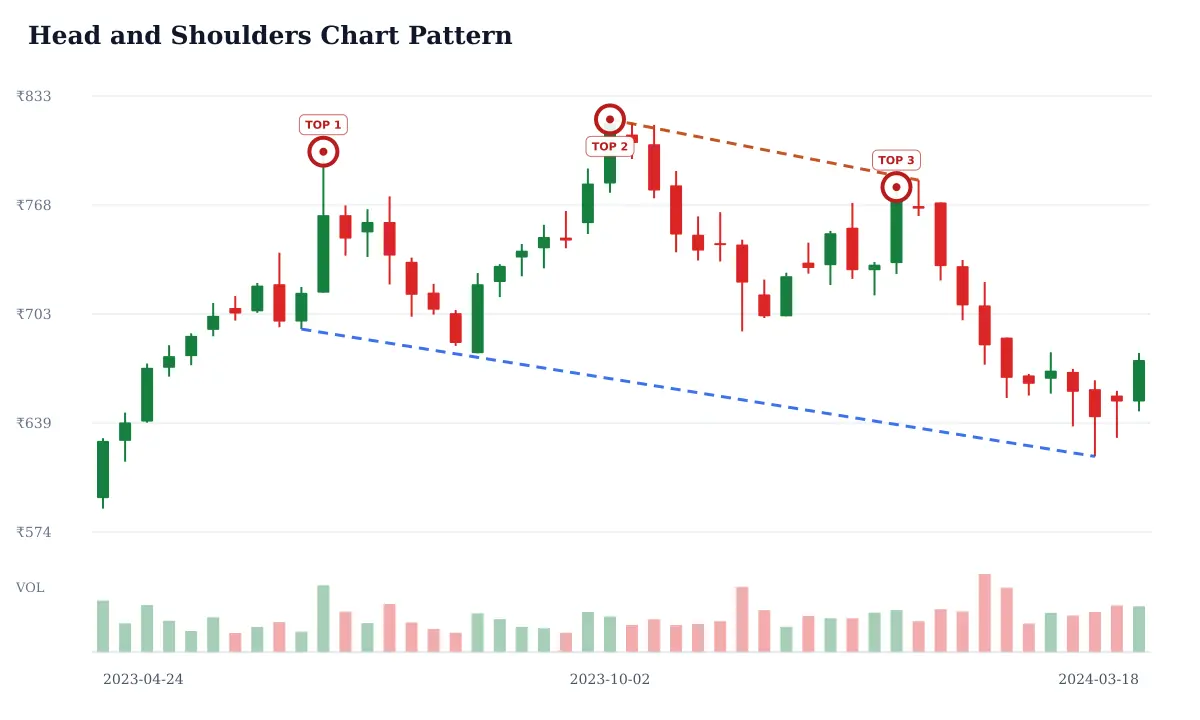
This bearish reversal structure has three peaks: a left shoulder, a higher head, and a right shoulder that usually stays below the head. The neckline joins the reaction lows. A completed candle close beneath that line is a possible confirmation; a quick reclaim can signal a failed breakdown.
Inverse Head and Shoulders Pattern
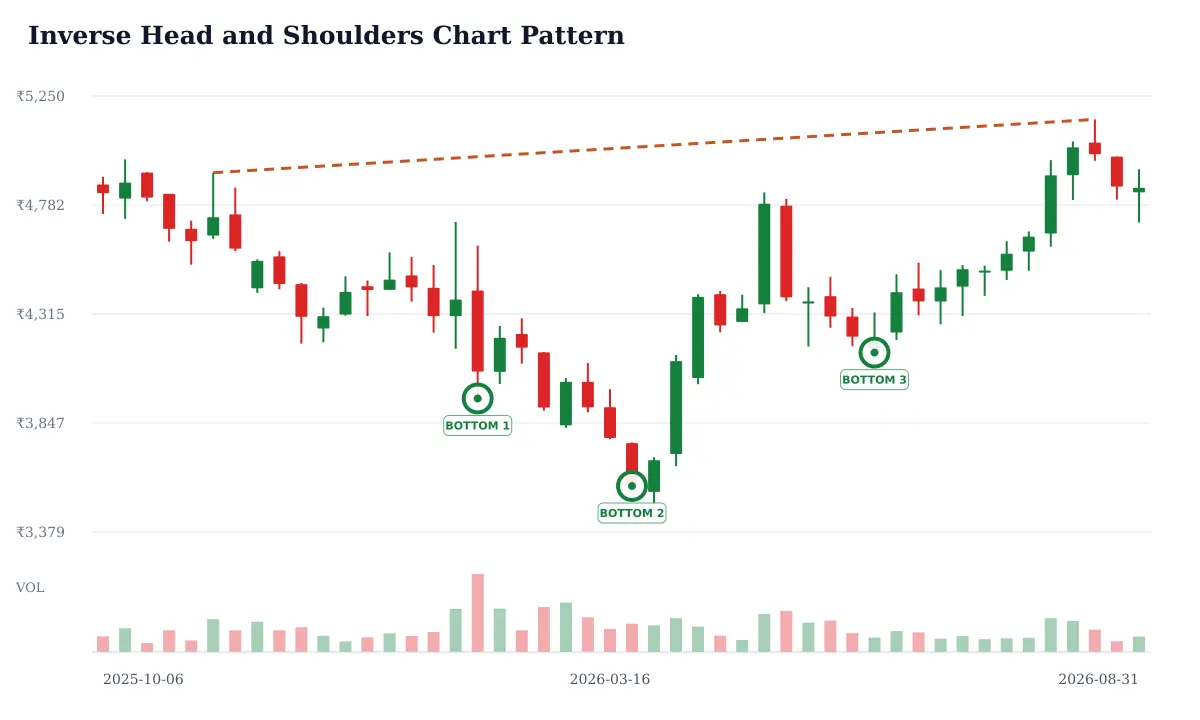
The bullish counterpart forms three troughs, with the middle trough deepest. A neckline connects the two intervening highs. Traders often wait for a close above it rather than treating the third low as proof of a reversal. A close back below the neckline weakens the idea.
Double Top Pattern
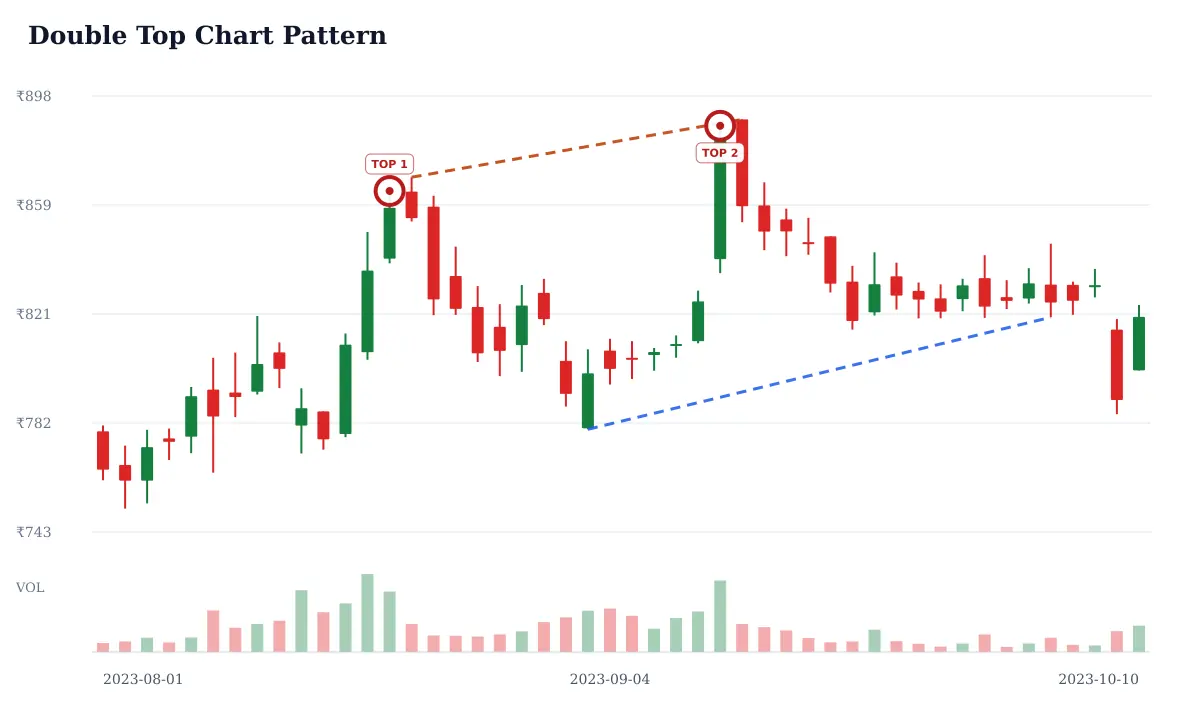
A double top has two peaks near a similar resistance area, separated by a pullback. The pullback low is the neckline. The shape is only a potential reversal until price closes below that level; matching highs by themselves do not establish that buyers have lost control.
Double Bottom Pattern
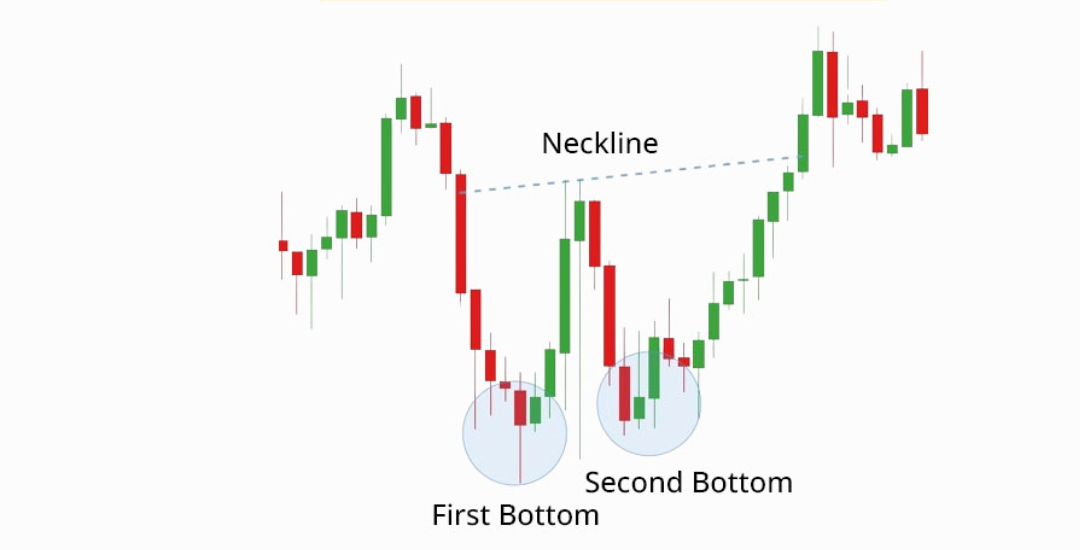
A double bottom consists of two troughs around a similar support area, with a reaction high between them. That high becomes the neckline. A close above it is a common confirmation rule, while a fresh close below the lows invalidates the bullish interpretation.
Triple Top Pattern
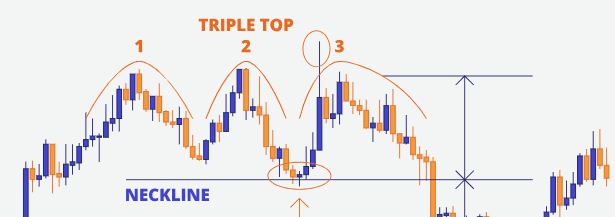
A triple top shows three tests of resistance, usually separated by two reaction lows. Repeated rejection can reveal supply, but the pattern remains incomplete until price breaks the support joining those lows. Strong closes above resistance instead argue against a top.
Triple Bottom Pattern
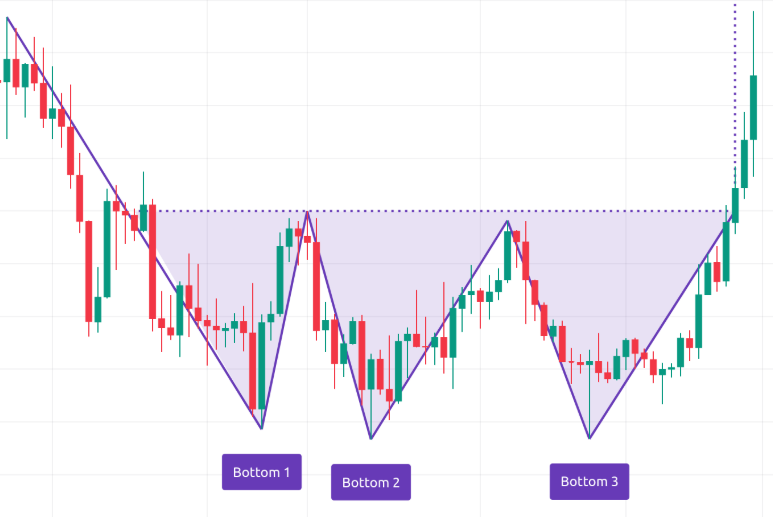
A triple bottom marks three tests of a support zone with two rebounds between them. It may show repeated buying interest, but it is not a confirmed reversal while price remains under the intervening highs. A close below the support zone defeats the setup.
Ascending Triangle Pattern
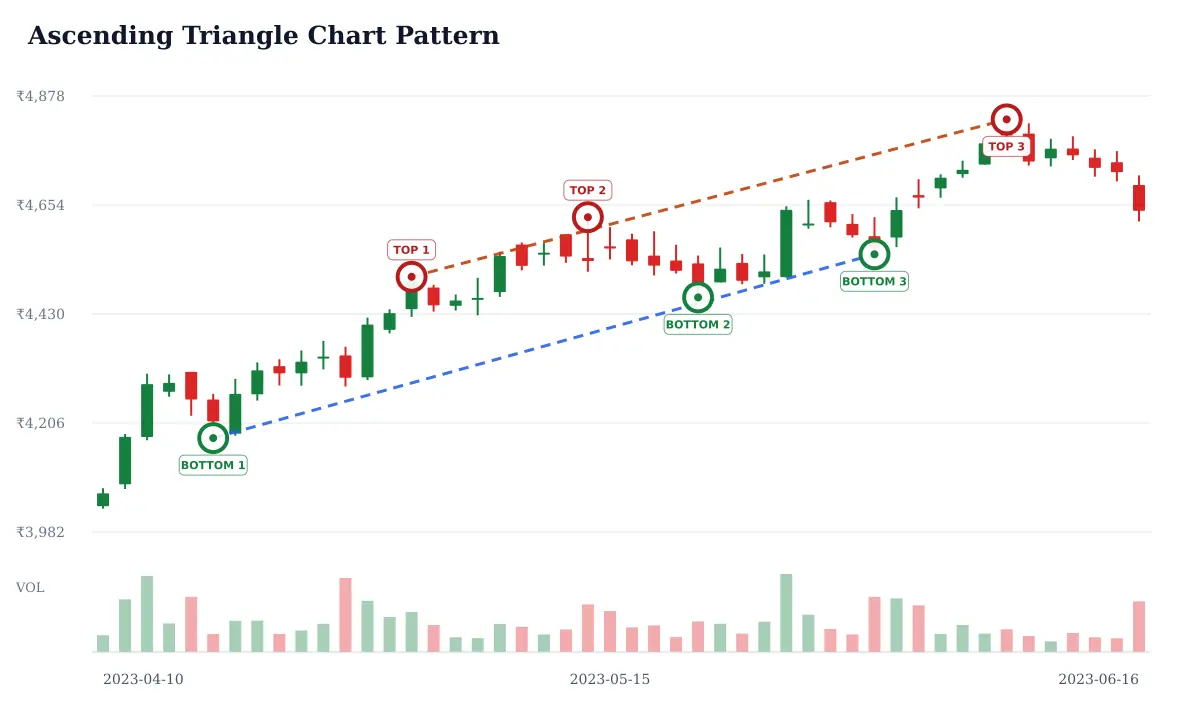
An ascending triangle pairs a relatively flat ceiling with rising reaction lows, creating a narrowing range. The higher lows suggest buyers are pressing, but the pattern is not inherently a breakout. Look for a decisive close above resistance and check whether price can hold the level.
Descending Triangle Pattern
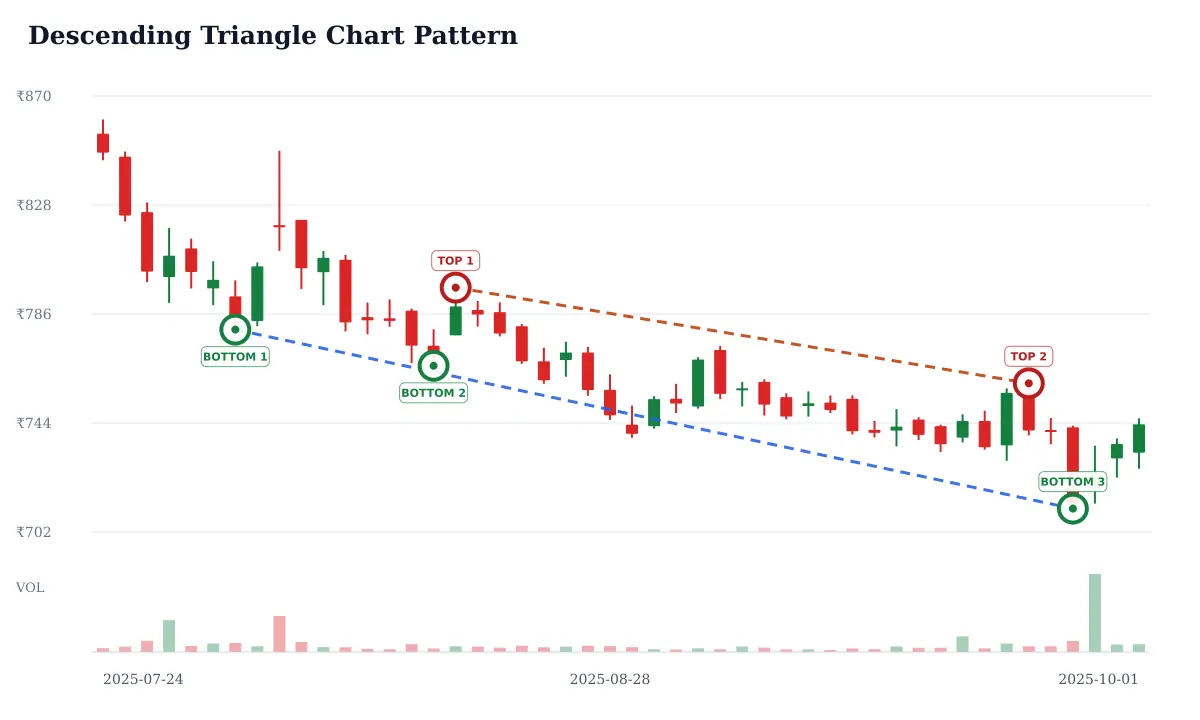
A descending triangle has a relatively flat support floor and a sequence of lower highs. The falling peaks can signal increasing supply, yet support may still hold. A close below the floor is the usual bearish trigger; a sustained move above the falling resistance weakens it.
Symmetrical Triangle Pattern
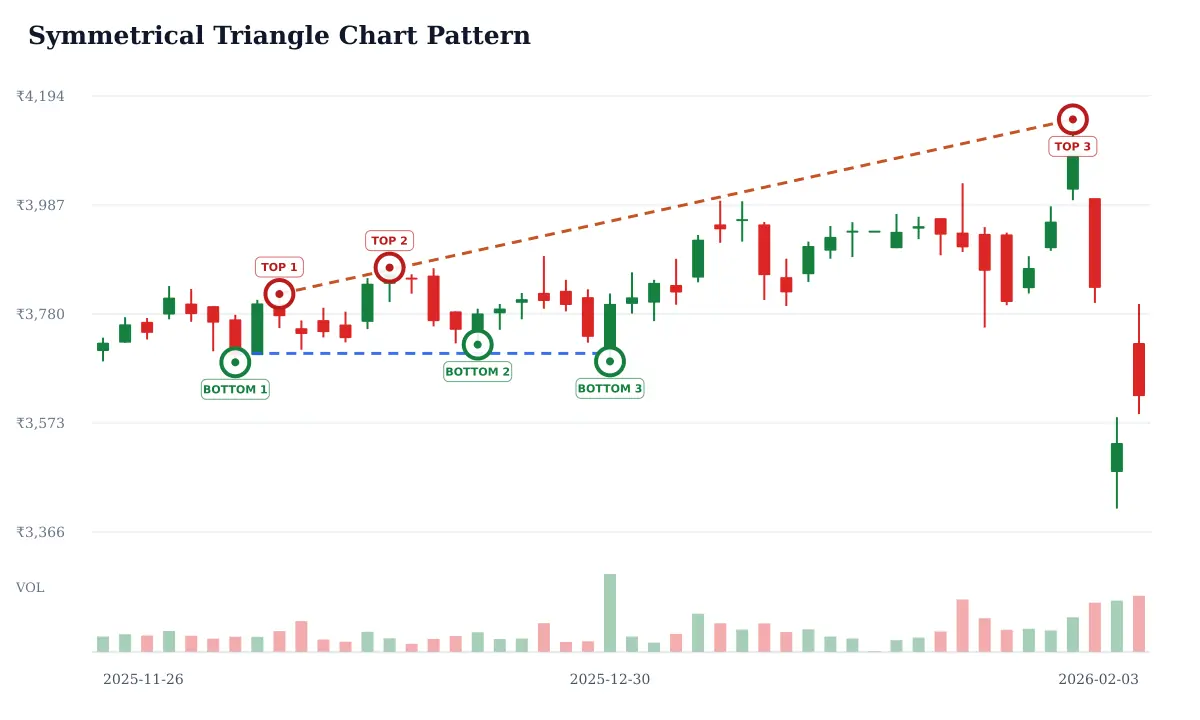
A symmetrical triangle forms as lower highs and higher lows converge toward an apex. It describes contraction, not a guaranteed direction. Wait for a candle close outside a boundary and watch for a failed breakout that returns price to the range.
Bull Flag Pattern
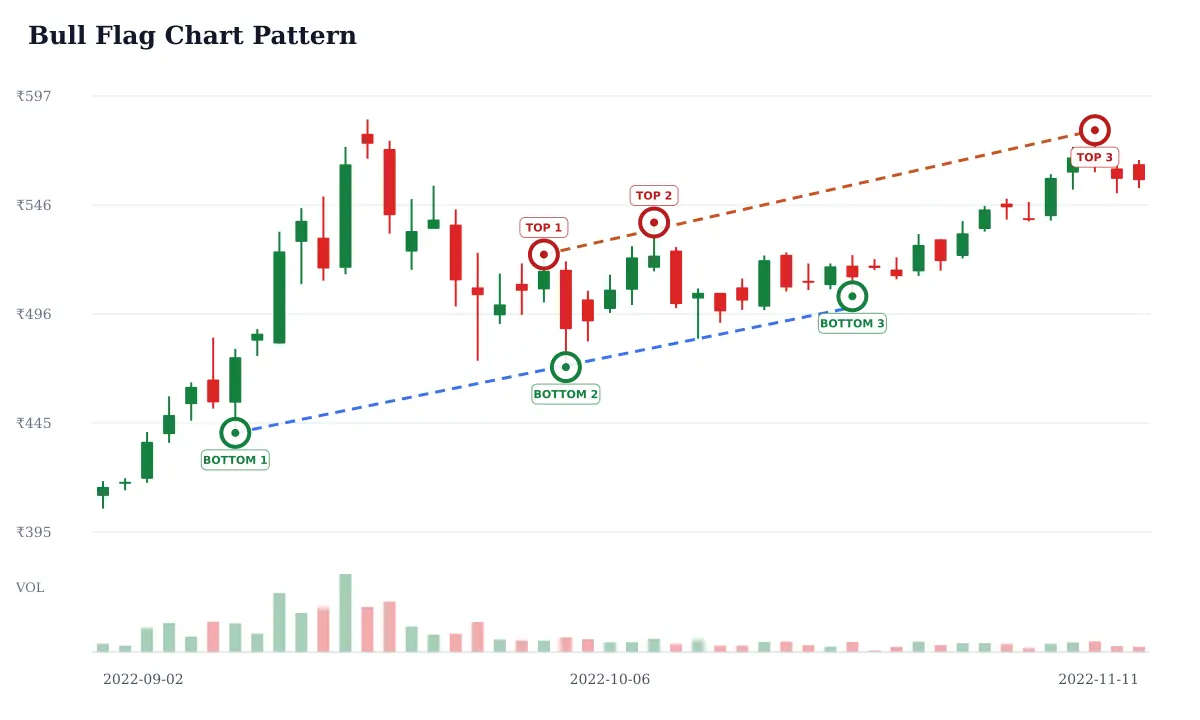
A bull flag follows a sharp upward move, or pole, with a compact pause that often slopes down or moves sideways. The continuation idea strengthens only if price closes above the flag's upper boundary. A deep retracement or a break below the flag low challenges it.
Bear Flag Pattern
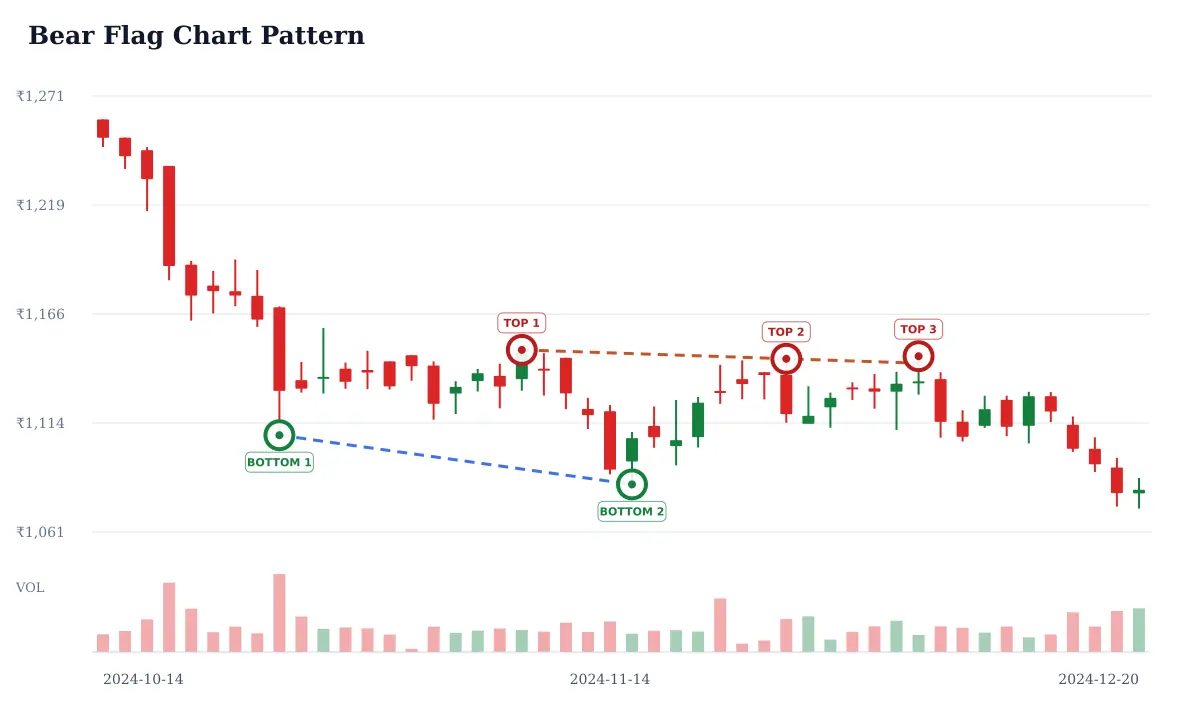
A bear flag follows a sharp decline with a short, often upward-sloping consolidation. It can represent a pause in selling rather than a reversal. A close below the flag support is the common continuation trigger; a strong reclaim above the flag high argues against it.
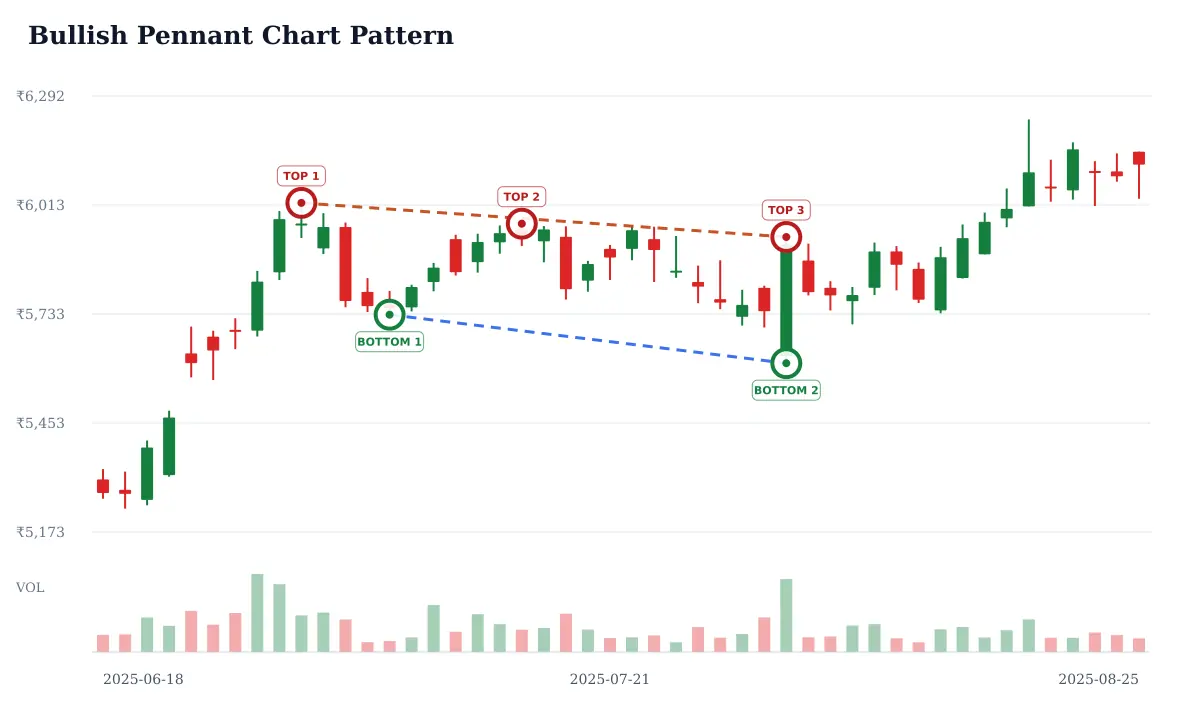
Bullish Pennant Pattern
A bullish pennant is a strong advance followed by a small contracting triangle. The earlier move supplies the pole; the narrowing pause supplies the pennant. A close above its upper boundary may confirm continuation, but low volume, an extended pole, or a failed retest can reduce its usefulness.
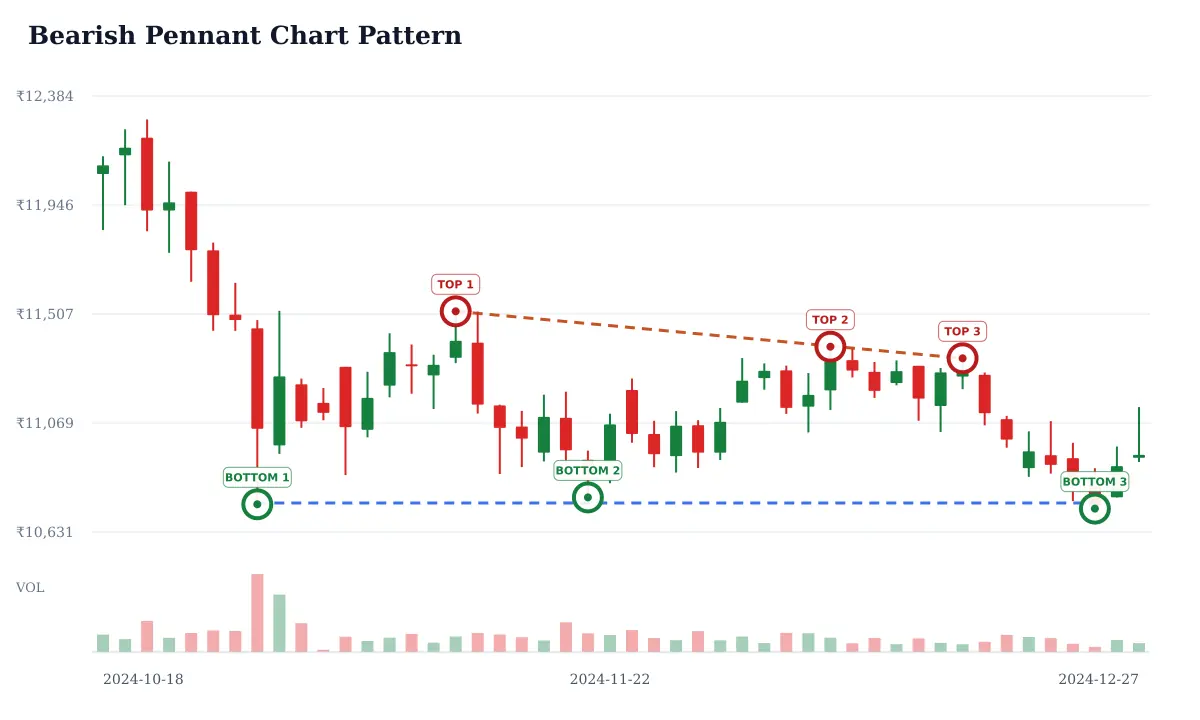
Bearish Pennant Pattern
A bearish pennant is a sharp decline followed by a compact, converging pause. It is a continuation hypothesis, not a prediction. Traders commonly look for a close below pennant support and define invalidation above its high; a break in the opposite direction changes the reading.
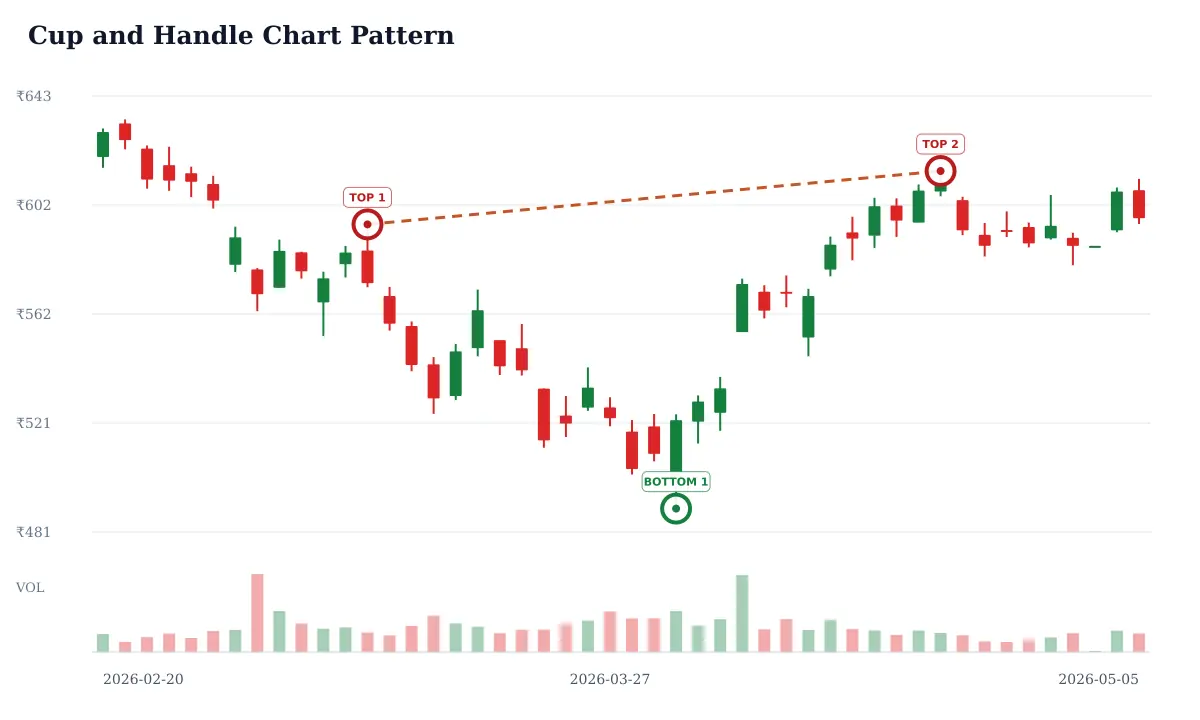
Cup and Handle Pattern
The cup and handle has a rounded recovery toward an earlier high, followed by a smaller pullback or sideways handle near the rim. A close above the rim is a possible breakout. A very deep handle, weak liquidity, or a close back inside the cup warrants caution.
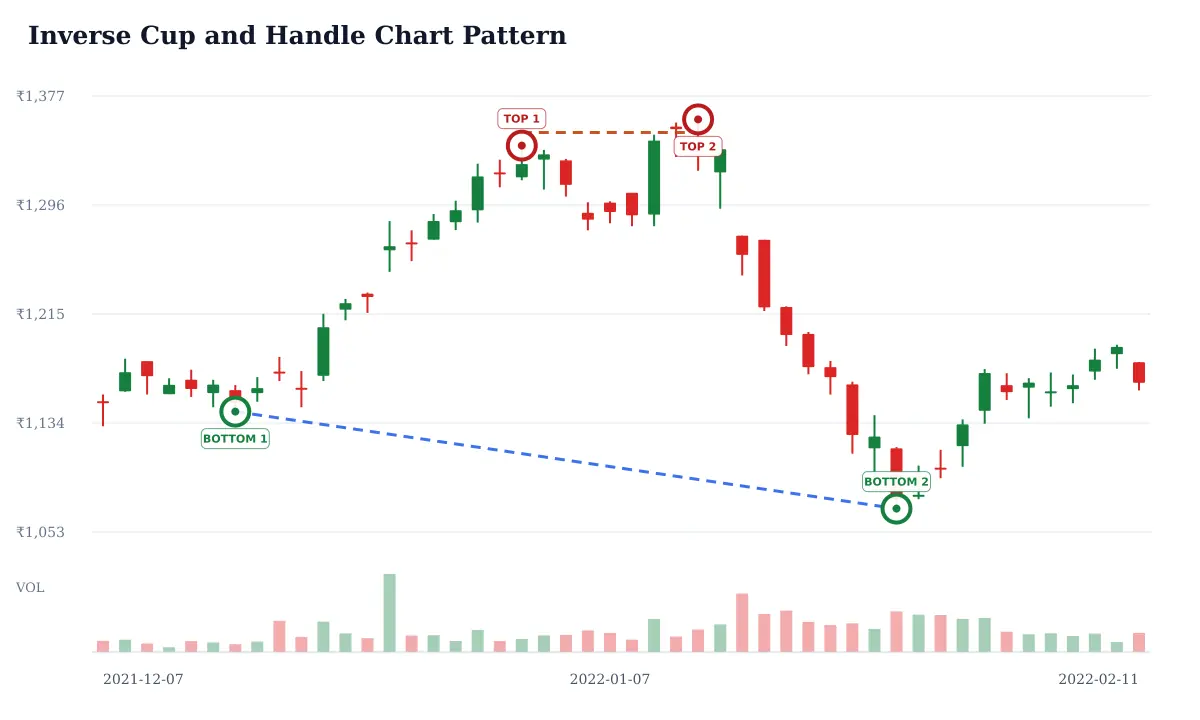
Inverse Cup and Handle Pattern
The inverse cup and handle is a rounded decline back toward prior support, followed by a smaller upward pause near the base. A close below that base is a possible bearish continuation signal. A strong reclaim through the handle high weakens the breakdown thesis.
Rising Wedge Pattern
A rising wedge has higher highs and higher lows, but its two boundaries converge as the advance loses range. It is often treated as a bearish warning, especially after a long rise. A close below support is more meaningful than the shape alone; a push above resistance invalidates that reading.
Falling Wedge Pattern
A falling wedge contains lower highs and lower lows within converging boundaries. The contracting decline can precede an upward reversal or continuation, depending on context. A close above the upper boundary is a common trigger; a lower low after the break undermines it.
Rectangle Pattern
A rectangle is a trading range bounded by repeated reactions near horizontal support and resistance. It is neutral until price leaves the range. Confirm with a close outside the boundary, then watch for a retest; a return inside can mark a false breakout.
Rounding Bottom Pattern
A rounding bottom is a gradual U-shaped transition from falling prices to a base and recovery. It develops over many candles, so isolated V-shaped swings are not enough. A close above the prior resistance area may confirm a change in structure; a break below the base negates it.
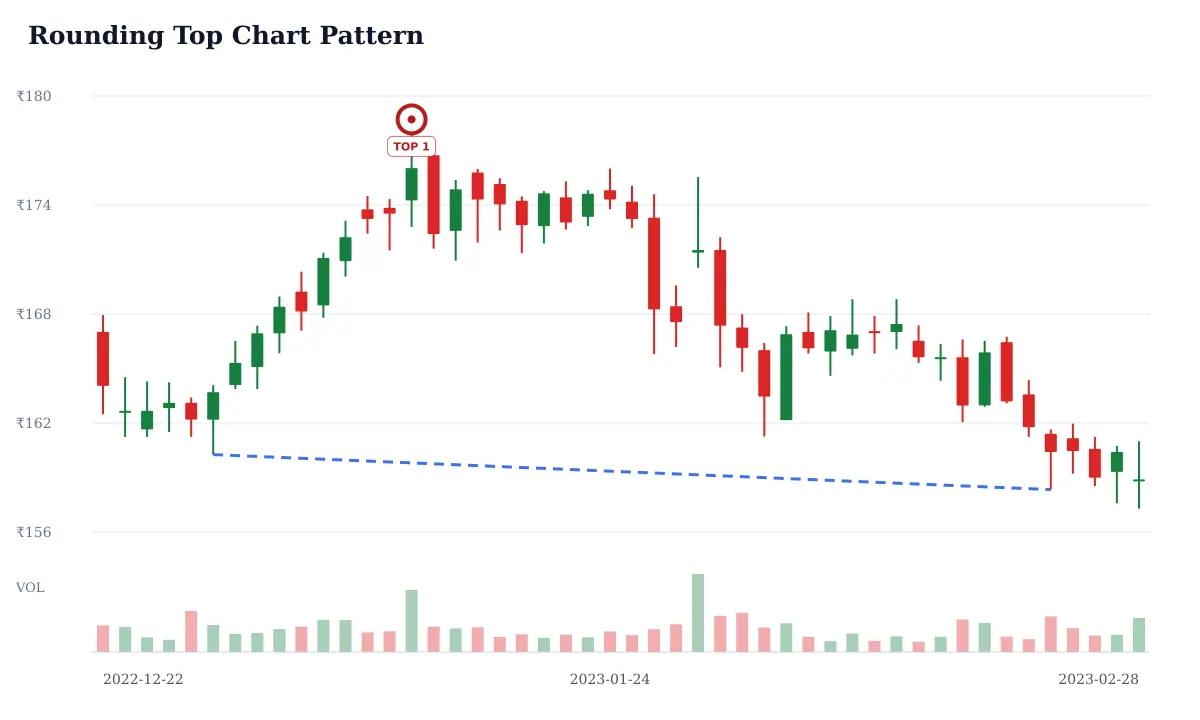
Rounding Top Pattern
A rounding top is a gradual arch in which an advance stalls and gives way to lower prices. Confirmation usually requires a close below the base or support area formed during the transition. A new sustained high above the arc signals that the bearish reading may be wrong.
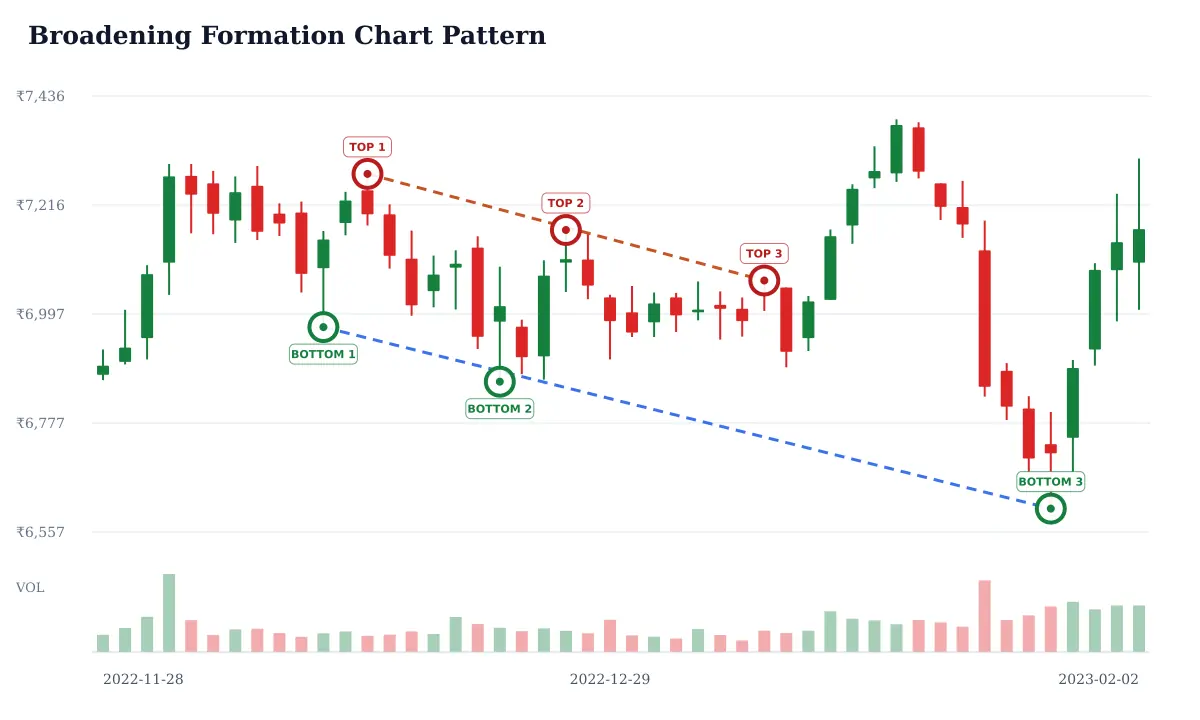
Broadening Formation Pattern
A broadening formation has expanding swings: successive highs and lows spread farther apart, producing diverging boundaries. It signals rising volatility and unstable agreement, not a dependable direction. Use the latest boundary break and a clear invalidation level; avoid assuming every expansion resolves downward.
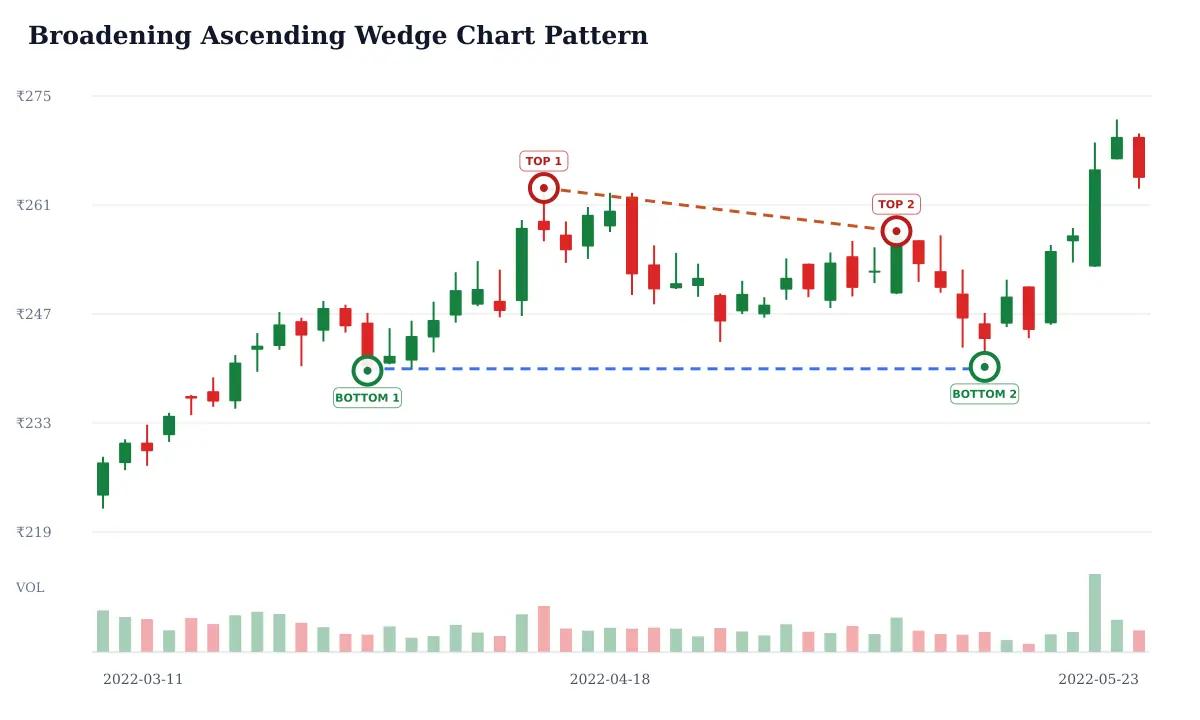
Broadening Ascending Wedge Pattern
This formation expands upward: both swing highs and lows rise, while the distance between the boundaries widens. The wider swings can make risk difficult to control. A close below the lower boundary is a bearish warning; a sustained move above the upper boundary contradicts it.
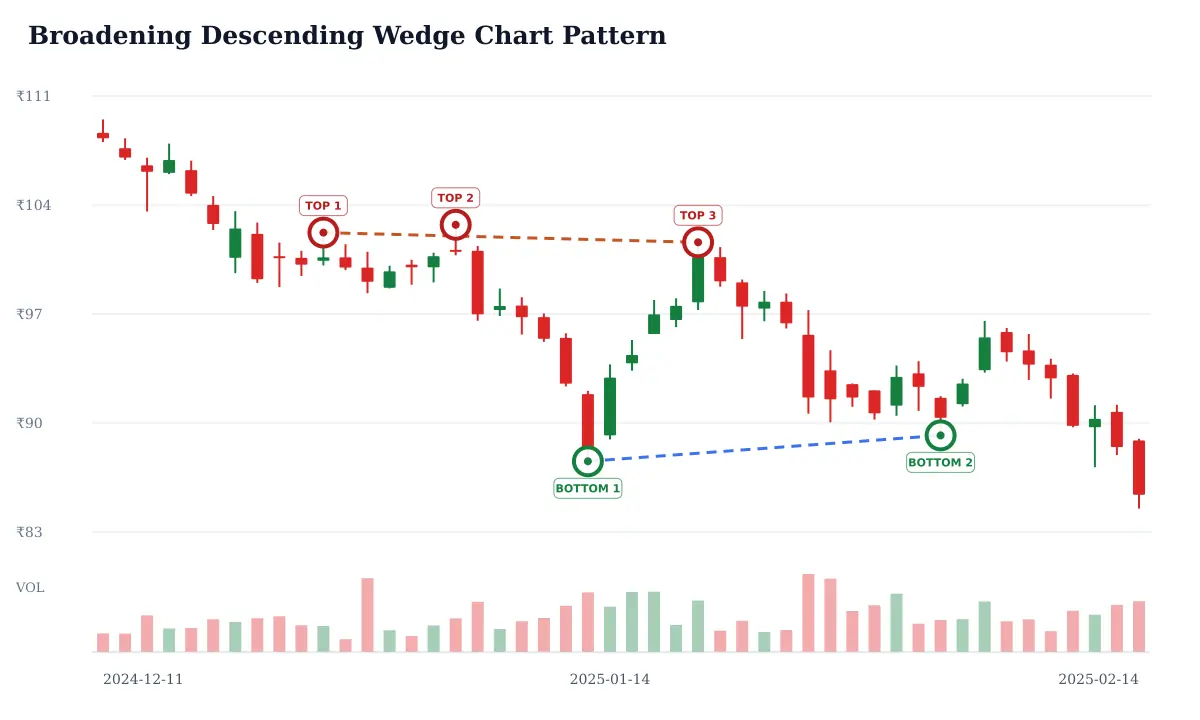
Broadening Descending Wedge Pattern
A broadening descending wedge expands lower as successive swings widen within downward-sloping boundaries. It can precede a rebound, but the pattern's widening volatility makes premature entries risky. A close above the upper boundary is one possible trigger; a new low weakens the reversal case.
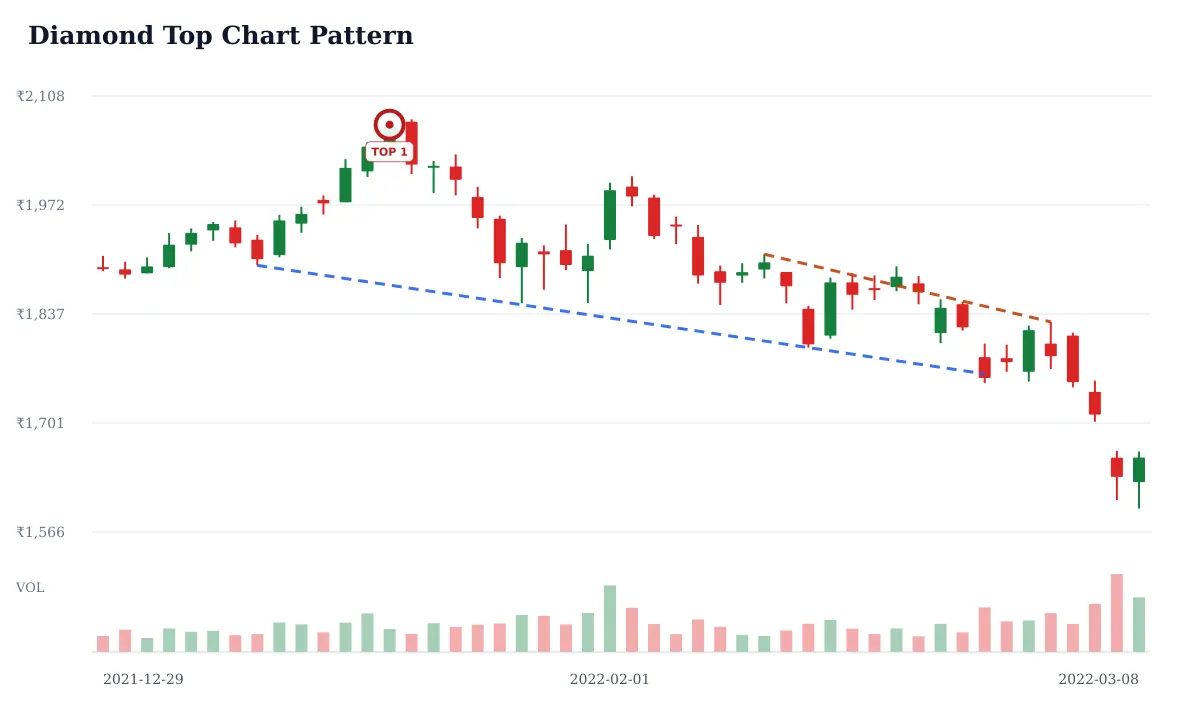
Diamond Top Pattern
A diamond top combines an expanding swing structure with a later contraction near a market peak. The outline resembles a diamond, but the visual shape can be subjective. A close below the formation's support is a possible bearish confirmation; a break above its high challenges the top interpretation.
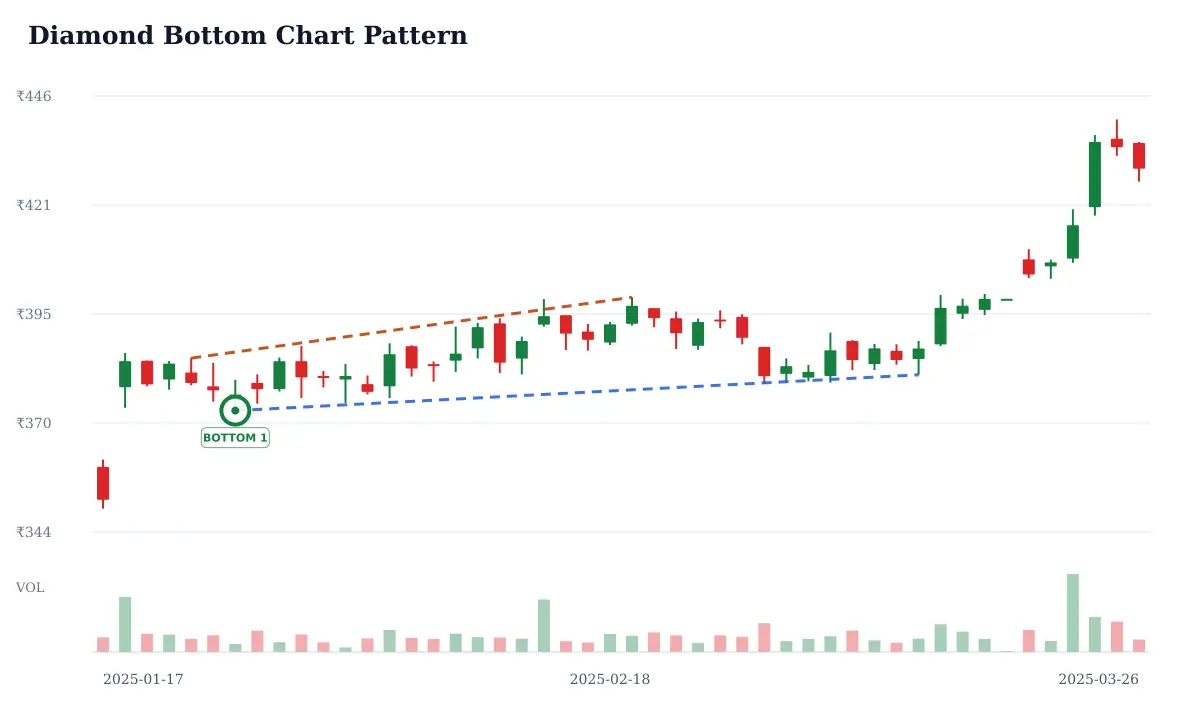
Diamond Bottom Pattern
A diamond bottom widens into volatile swings and then contracts near a possible market low. It may show a transition from disorder to balance, but the shape alone is not a buy signal. A close above the upper boundary is a possible confirmation; a fresh low invalidates the reversal idea.
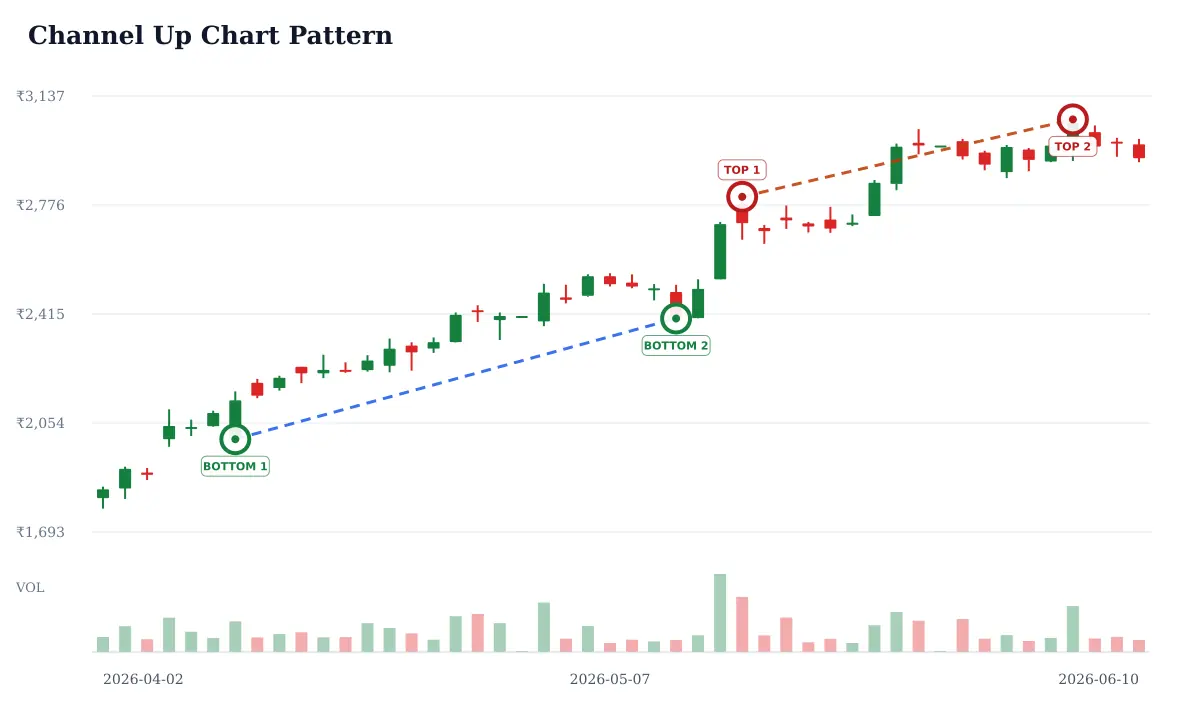
Channel Up Pattern
An upward channel uses roughly parallel rising boundaries: pullbacks find support near the lower rail while rallies approach the upper rail. It describes a rising trend, not a precise forecast. A close below the lower rail warns of a trend change; repeated upper-rail rejection can flag stretched momentum.
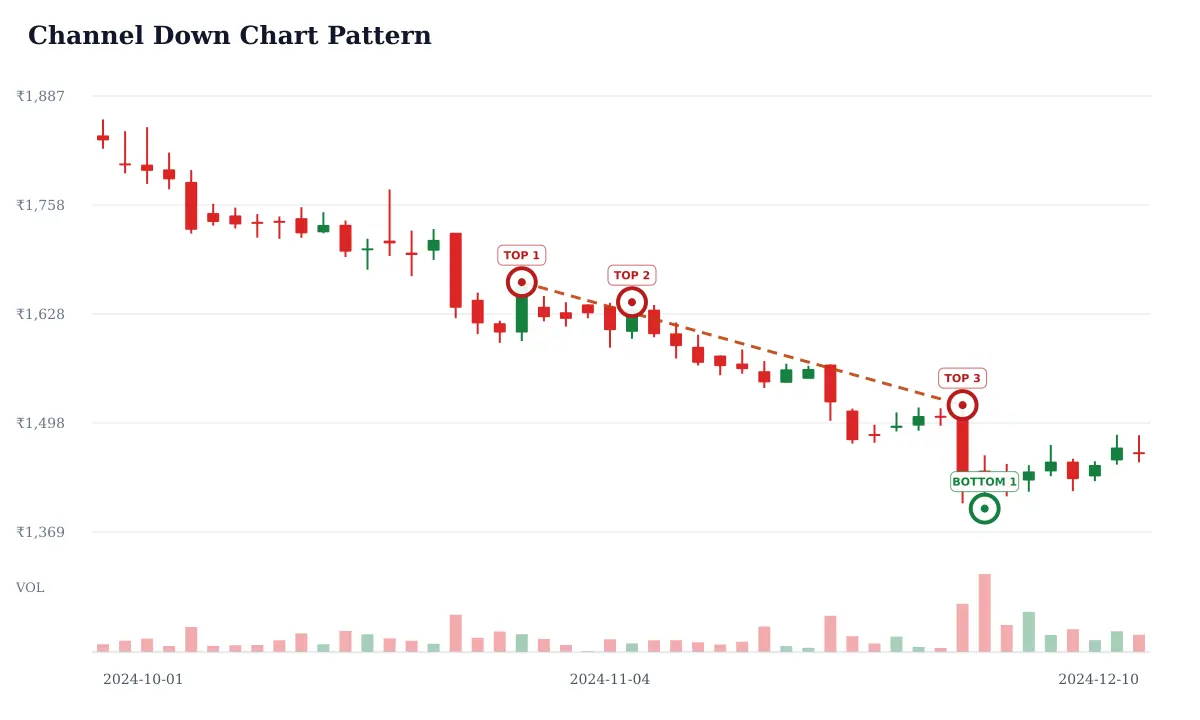
Channel Down Pattern
A downward channel has roughly parallel falling resistance and support lines, with lower highs and lower lows. It can help organize a downtrend, but a touch of support does not guarantee a bounce. A close above the upper rail may signal a change; a new low keeps the decline intact.
Horizontal Channel Pattern
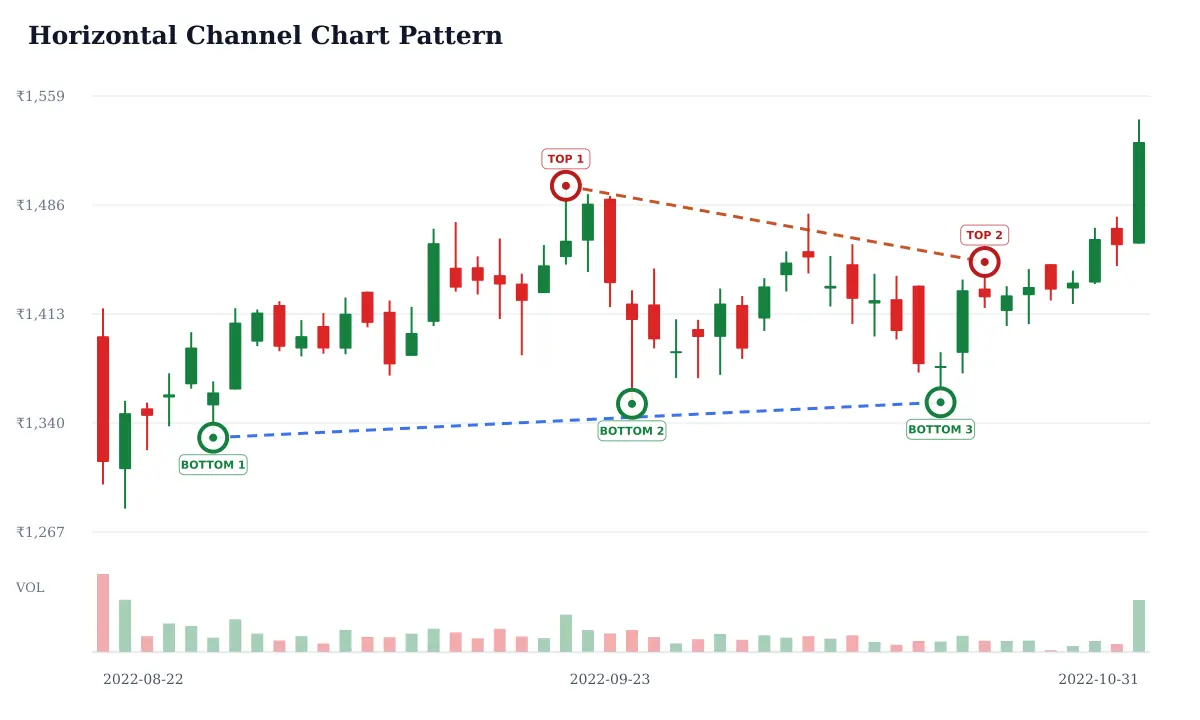
A horizontal channel is a range with repeated reactions around a ceiling and floor. Until price closes outside it, the market remains range-bound by this definition. Check for false breaks, corporate-action gaps, and adequate volume before treating a boundary breach as meaningful.
Bullish Megaphone Pattern
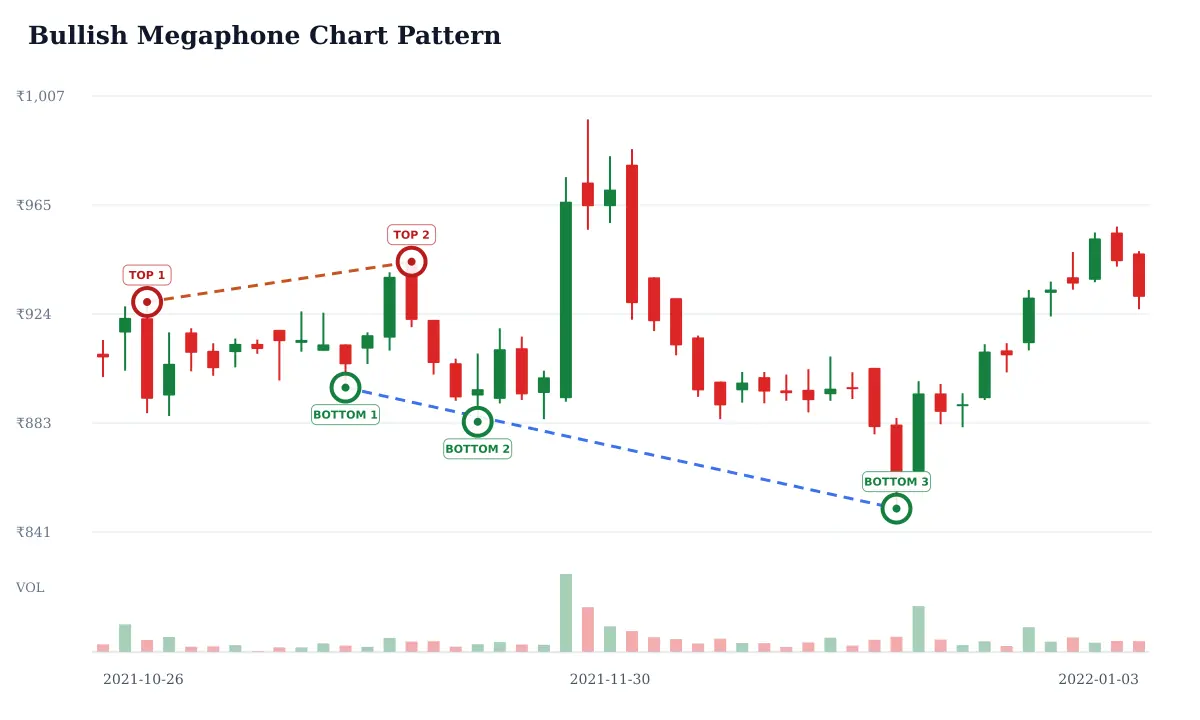
A bullish megaphone, often described as a megaphone bottom, has widening swings around a possible low. The expanding boundaries show disagreement and higher volatility. A close above the latest swing high may support a bullish reversal reading; a fresh low means the pattern has not held.
Bearish Megaphone Pattern
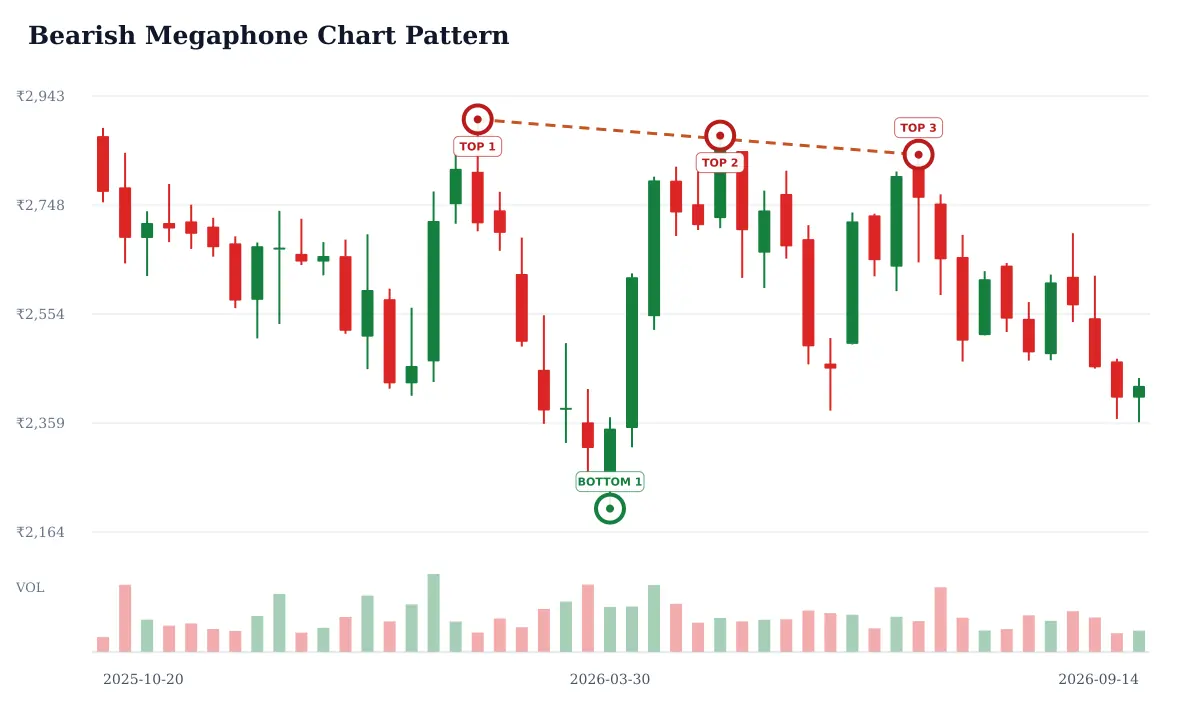
A bearish megaphone, often described as a megaphone top, has widening swings around a possible high. The pattern is volatile and can produce sharp moves in either direction. A close below the latest swing low may support a bearish reading; a sustained new high rejects it.
Bullish AB=CD Pattern
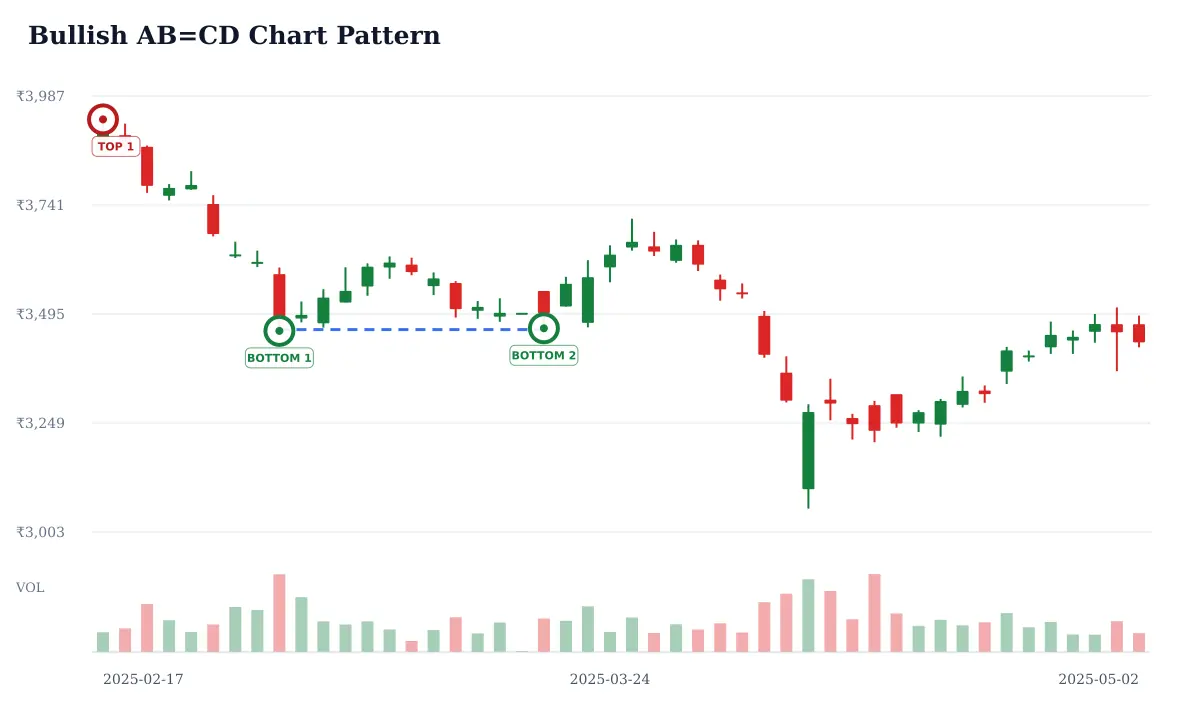
The bullish AB=CD is a four-point harmonic structure: price declines from A to B, retraces toward C, then declines toward D by a distance roughly comparable to AB. Traders watch D as a possible reversal zone; the measured equality is approximate, and a turn still needs price confirmation.
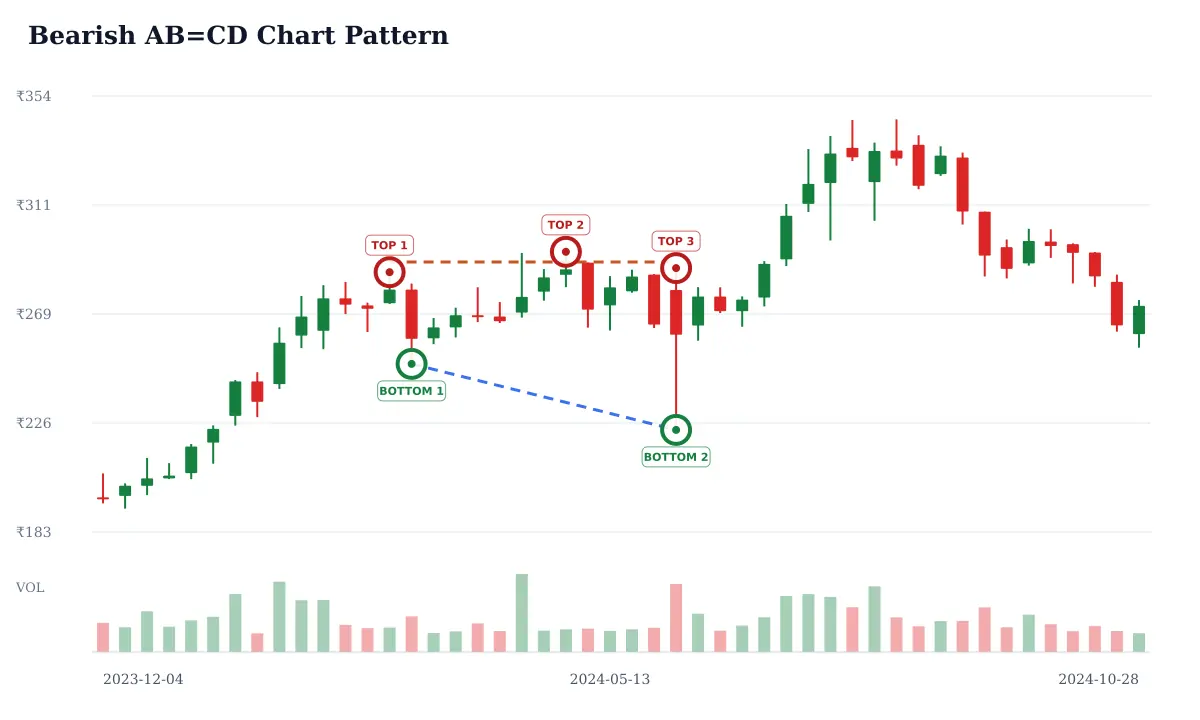
Bearish AB=CD Pattern
The bearish AB=CD mirrors the bullish structure at a possible high: price rises from A to B, pulls back toward C, then advances toward D by a distance roughly comparable to AB. D is a possible exhaustion area, not an automatic short entry; look for rejection and define invalidation.
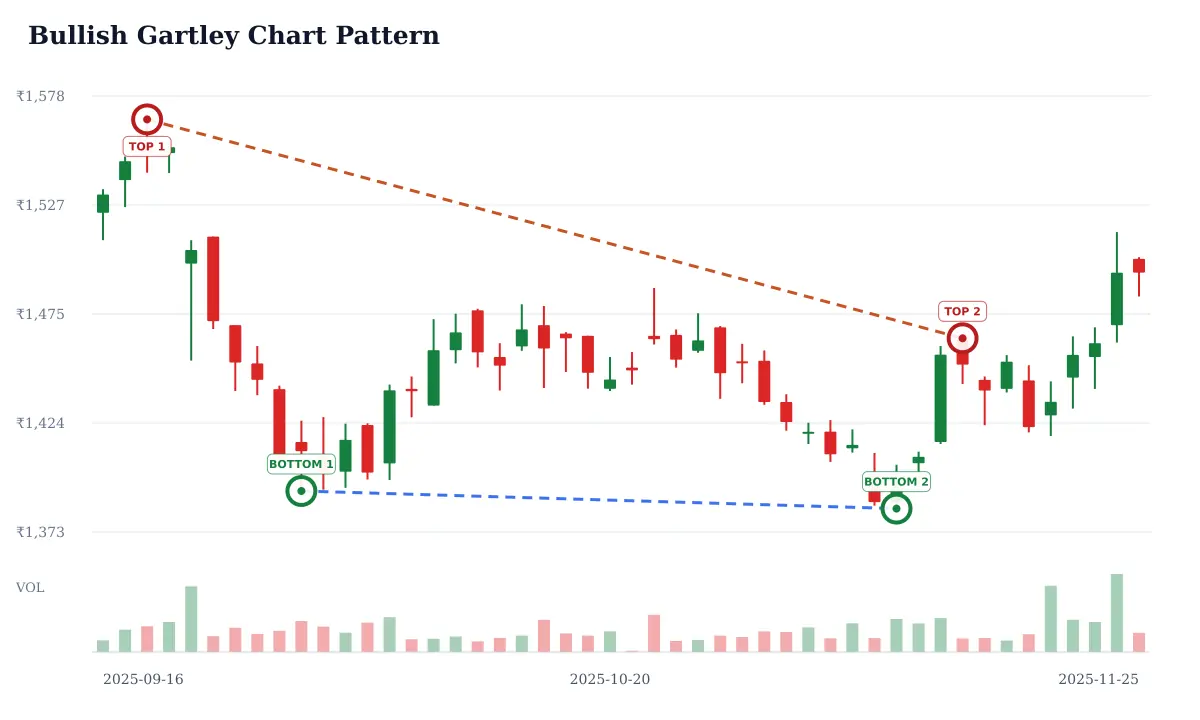
Bullish Gartley Pattern
A bullish Gartley is an X-A-B-C-D harmonic pattern with B commonly near a 61.8% retracement of XA and D near a 78.6% retracement of XA. C and the final leg have additional ratio rules. Traders treat the converging ratios as a potential reversal area, then wait for price evidence.
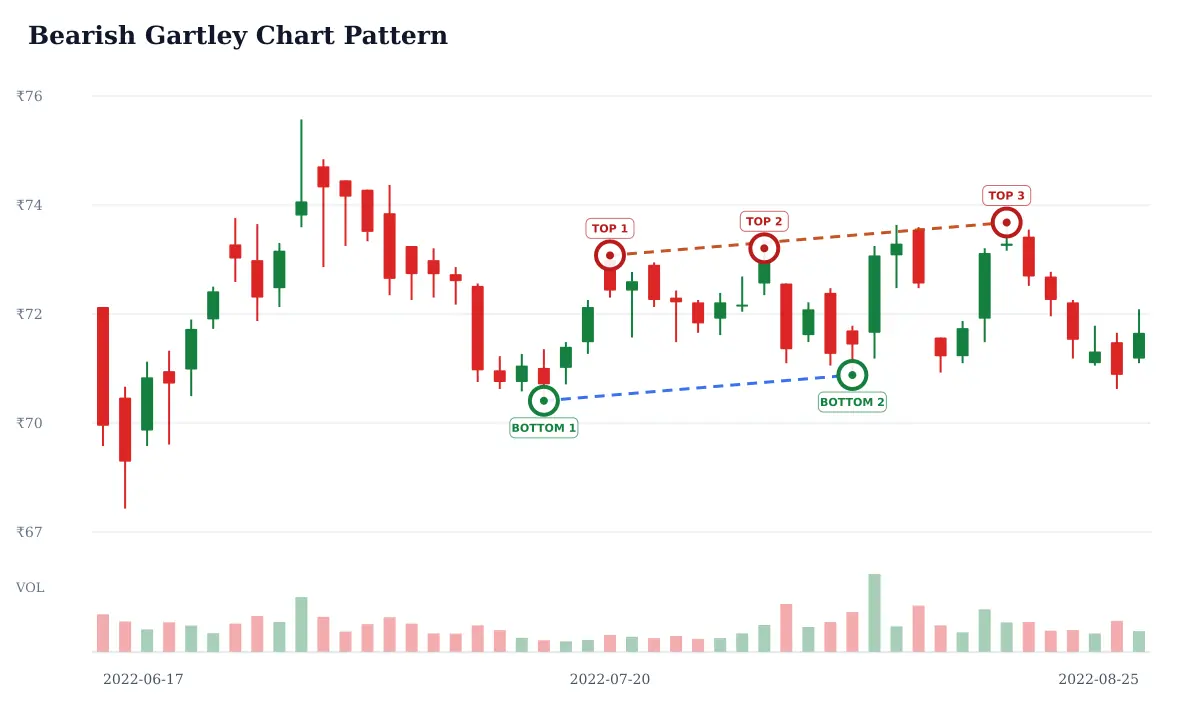
Bearish Gartley Pattern
The bearish Gartley is the mirrored X-A-B-C-D structure, with the final point near a commonly used 78.6% retracement of XA and B often near 61.8%. Fibonacci conventions vary slightly. A ratio match is only a watch area; a close back above the potential reversal zone can invalidate it.
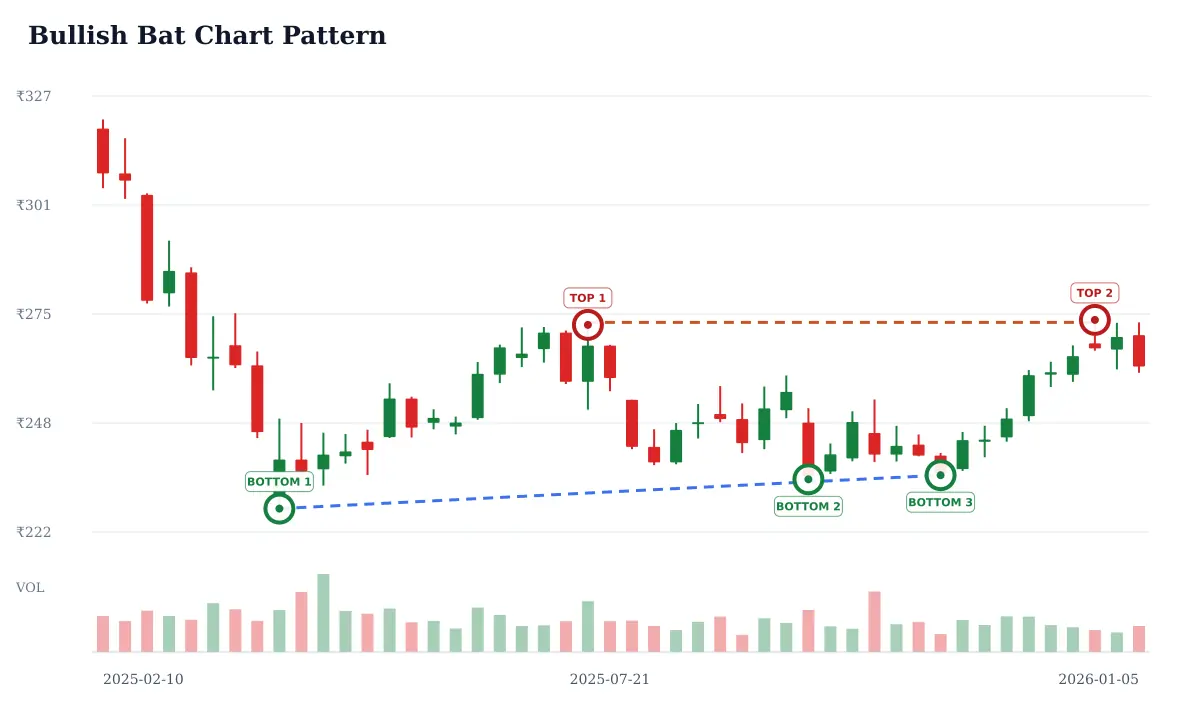
Bullish Bat Pattern
The bullish Bat is an X-A-B-C-D harmonic structure. A common convention places B around a 38.2%–50% retracement of XA and D near an 88.6% retracement of XA. The pattern suggests a potential demand zone at D, but traders still need a reversal trigger and defined risk.
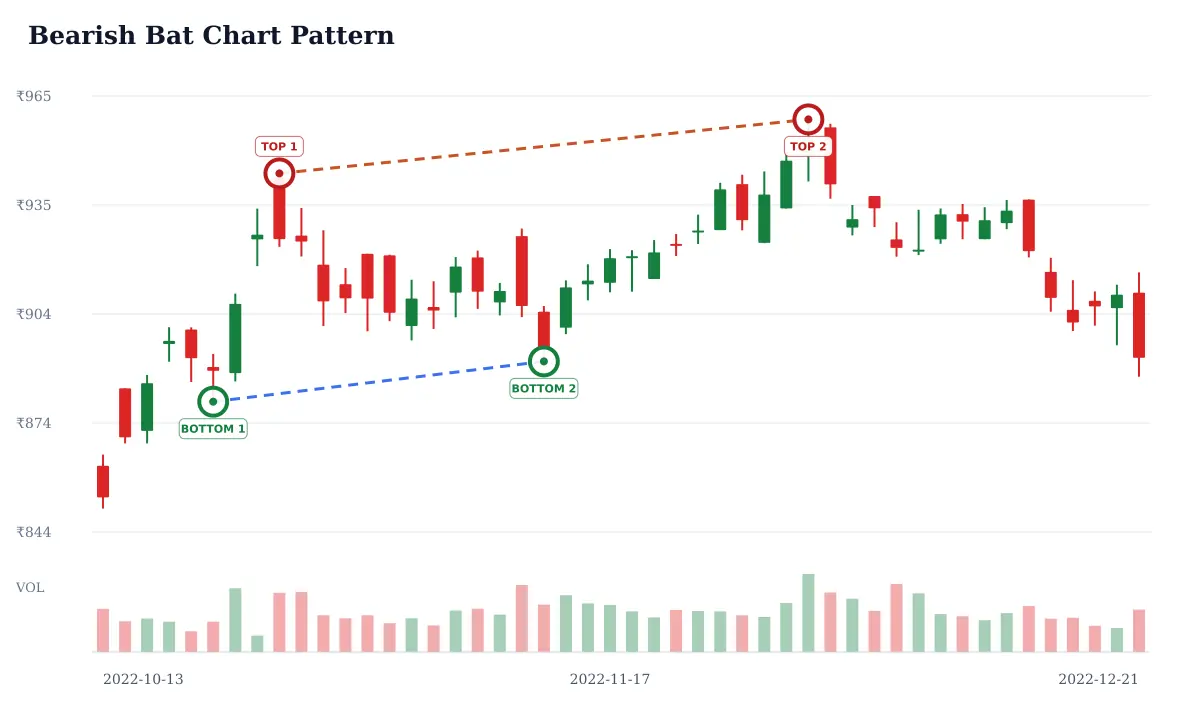
Bearish Bat Pattern
The bearish Bat mirrors the bullish pattern and often uses a 38.2%–50% B retracement of XA with D near an 88.6% retracement. A harmonic completion can identify a possible supply zone, not a guaranteed turn. A strong close through the zone is evidence against the setup.
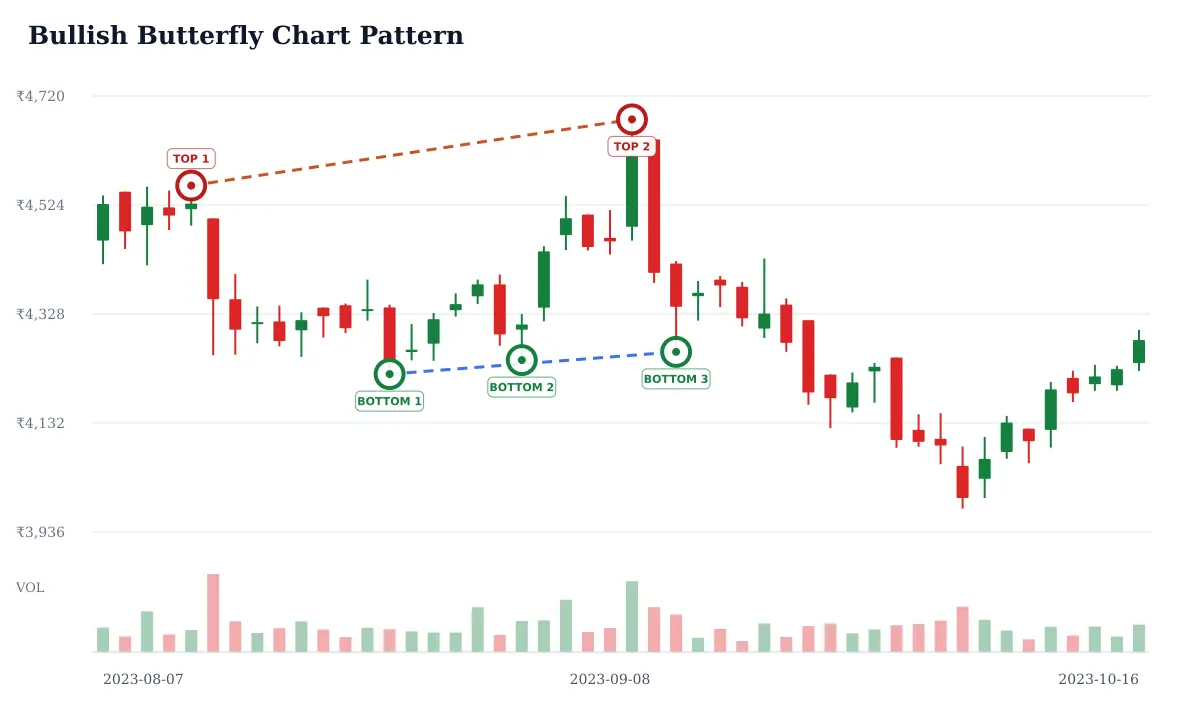
Bullish Butterfly Pattern
A bullish Butterfly is a five-point harmonic reversal that commonly places B near a 78.6% retracement of XA and D beyond A, often around a 127.2%–161.8% XA extension. The extension can make the completion zone wide. Wait for a turn in price rather than buying the ratio alone.
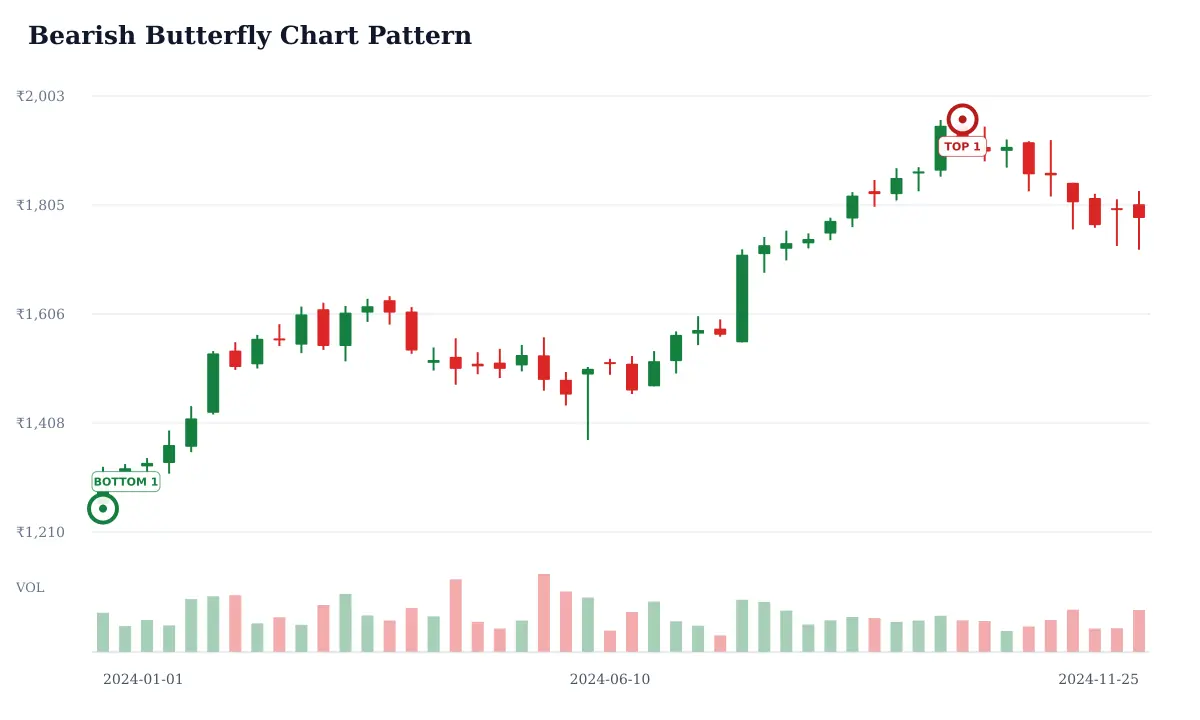
Bearish Butterfly Pattern
The bearish Butterfly mirrors the bullish X-A-B-C-D structure, often completing beyond A near a 127.2%–161.8% extension of XA. That extension marks a potential resistance zone, not a ceiling. A close above the zone invalidates the short-side reading; confirm any reversal with price action.
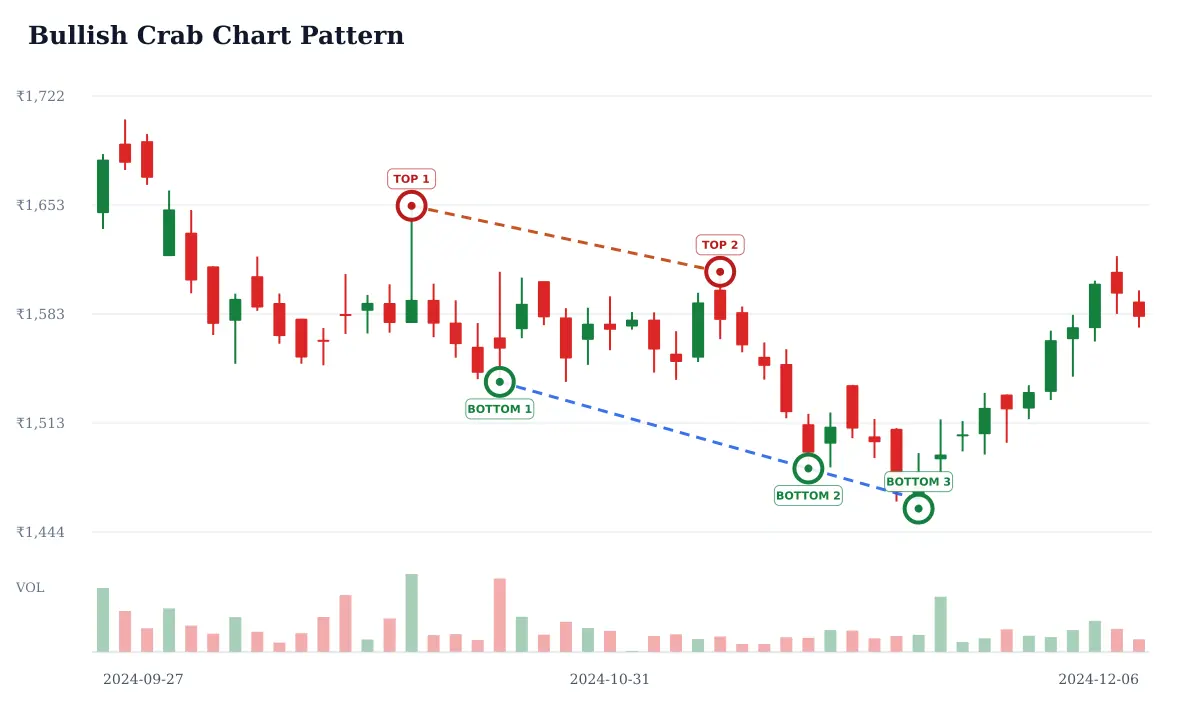
Bullish Crab Pattern
A bullish Crab is a harmonic reversal pattern whose D point commonly extends to about 161.8% of XA, with B and C constrained by separate Fibonacci relationships. The deep completion can identify a possible demand zone. It does not remove gap risk or the need for an invalidation level.
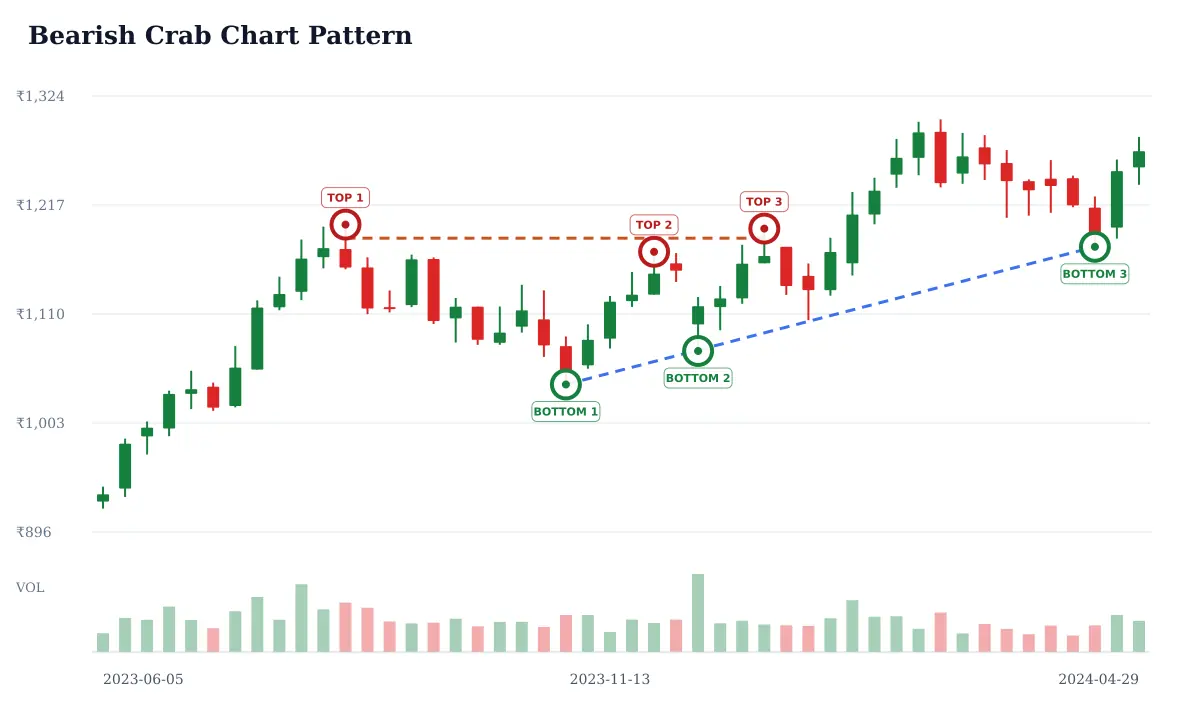
Bearish Crab Pattern
The bearish Crab mirrors the bullish structure and commonly places D near a 161.8% XA extension. Its wide projected zone can be difficult to trade precisely. Use one consistent ratio convention, wait for a visible rejection, and treat a sustained move beyond D as evidence that the setup failed.
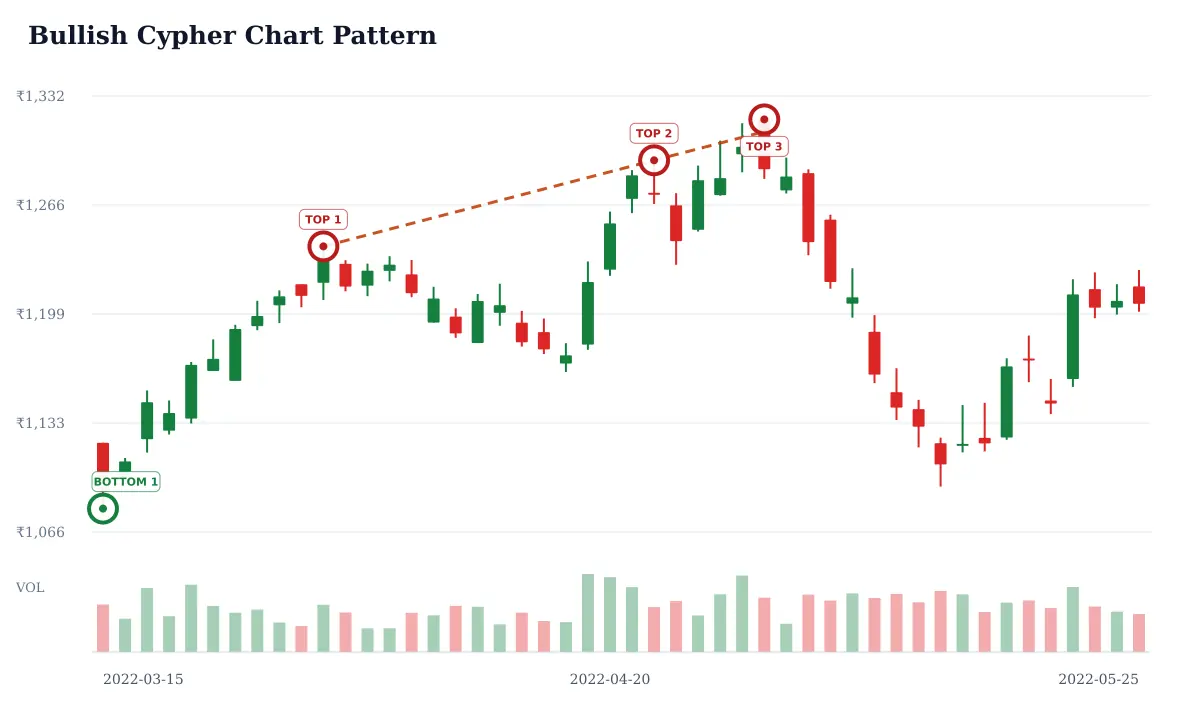
Bullish Cypher Pattern
A bullish Cypher typically has B retracing about 38.2%–61.8% of XA, C extending roughly 127.2%–141.4% of XA, and D near a 78.6% retracement of XC. Those ratios define a possible reversal area. Because pivot selection is subjective, require a clear price response before assigning meaning.
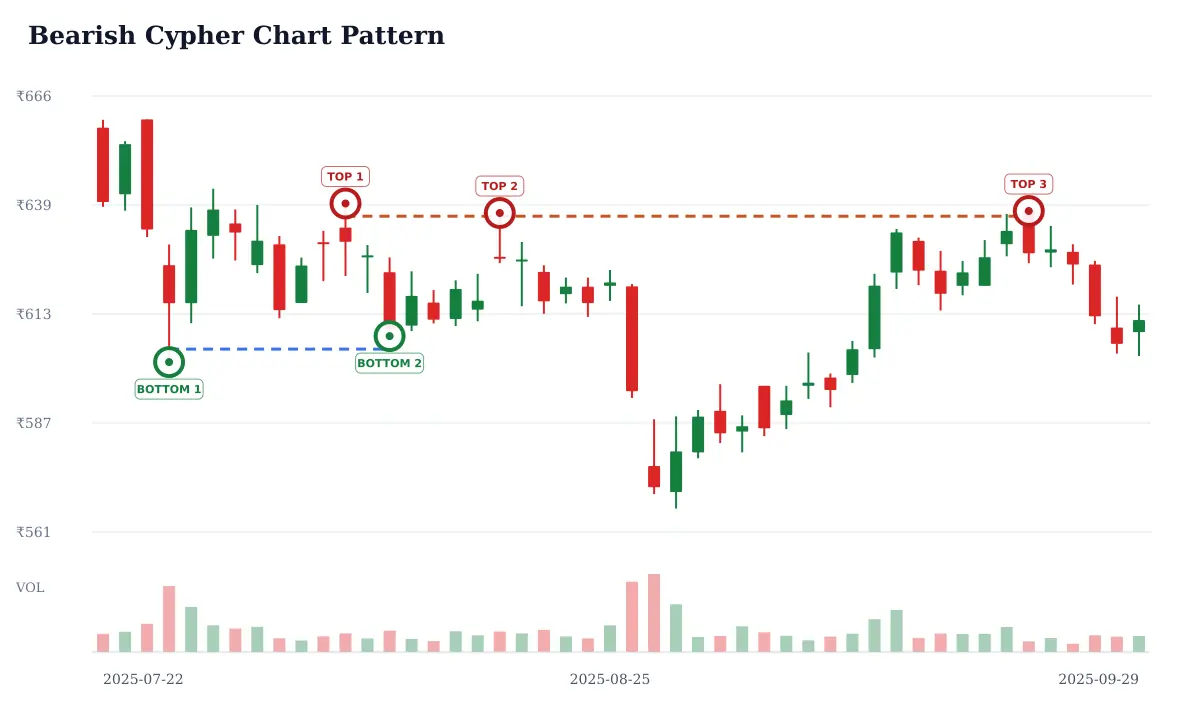
Bearish Cypher Pattern
The bearish Cypher mirrors the bullish ratio sequence: B retraces XA, C extends beyond X, and D retraces much of XC. The completion zone is a hypothesis about possible supply. If price holds above it and makes a new high, the bearish pattern has failed rather than being “almost confirmed.”
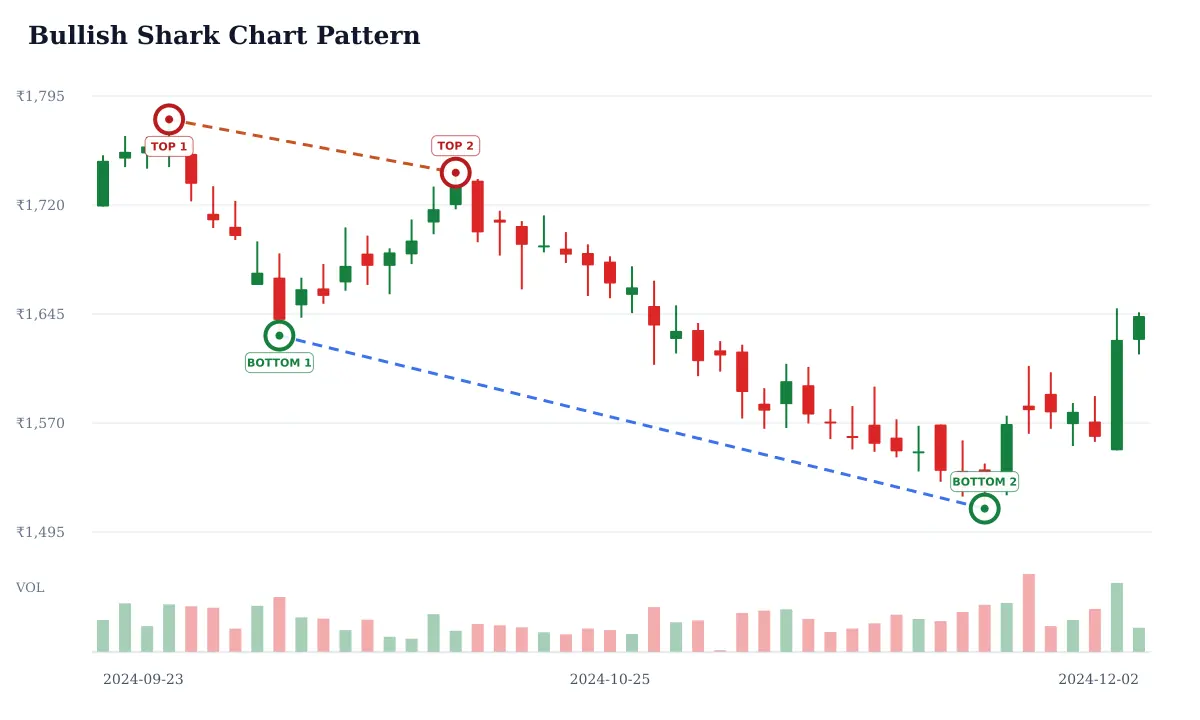
Bullish Shark Pattern
The bullish Shark is a five-pivot harmonic pattern whose common variants use extensions beyond earlier swings before a potential reversal. Naming and ratio conventions differ across sources, so state the rule set used rather than mixing definitions. A candidate is not confirmed until price reacts at the projected zone.
Bearish Shark Pattern
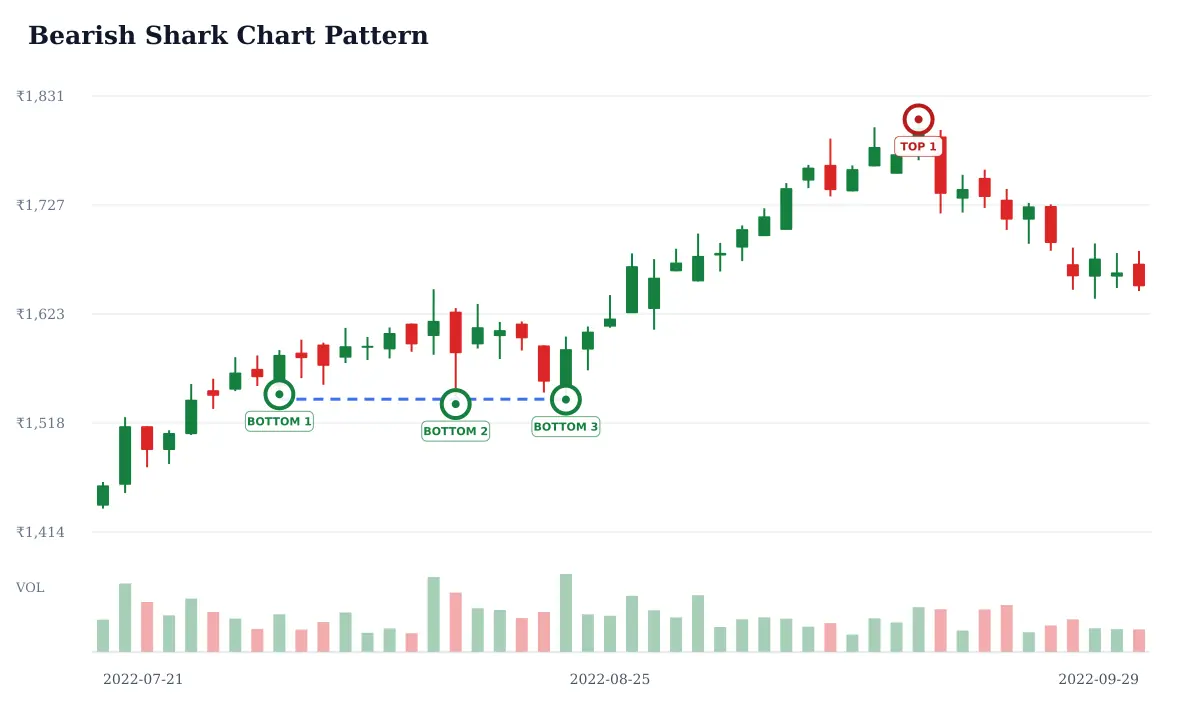
The bearish Shark is the mirrored harmonic structure, with an extended final swing that may reach a potential supply zone. Different references use slightly different pivot and ratio conventions. Mark the convention before measuring; a sustained move beyond the zone or a failure to turn undermines the interpretation.
Bullish 1-2-3 Reversal Pattern
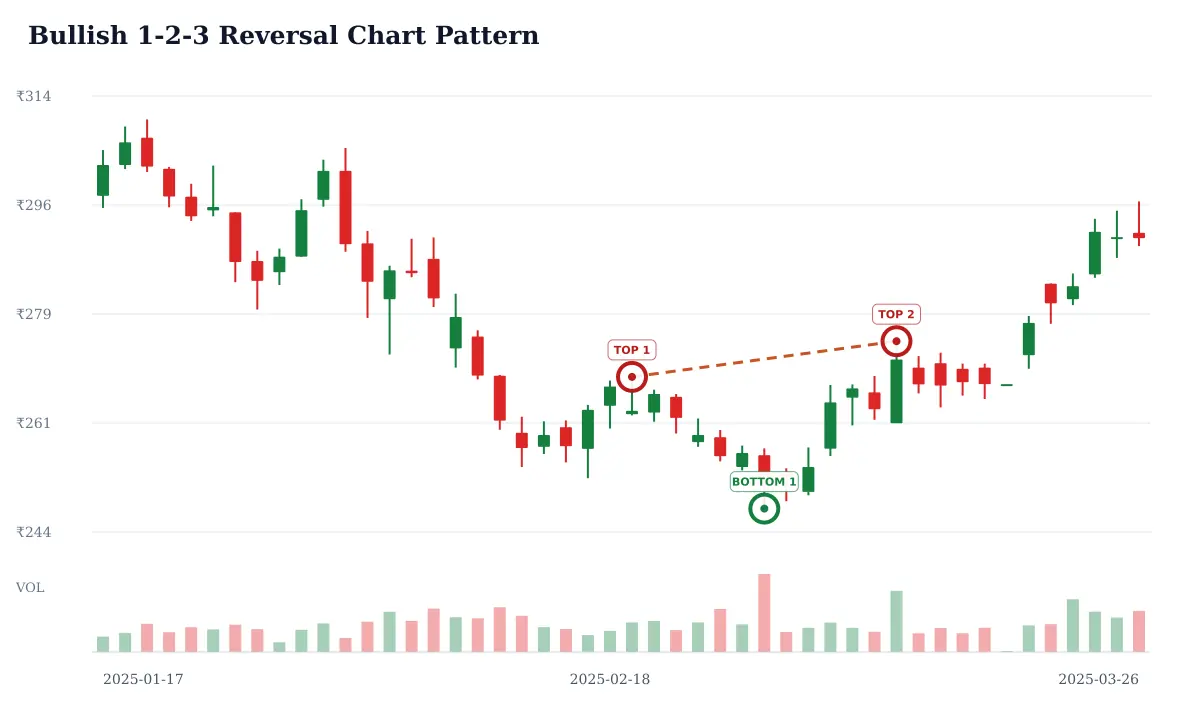
The bullish 1-2-3 reversal begins after a decline: point 1 is a low, point 2 is a rebound high, and point 3 is a higher low. A close above point 2 is a common trigger. A break below point 3 shows that the proposed sequence did not hold.
Bearish 1-2-3 Reversal Pattern
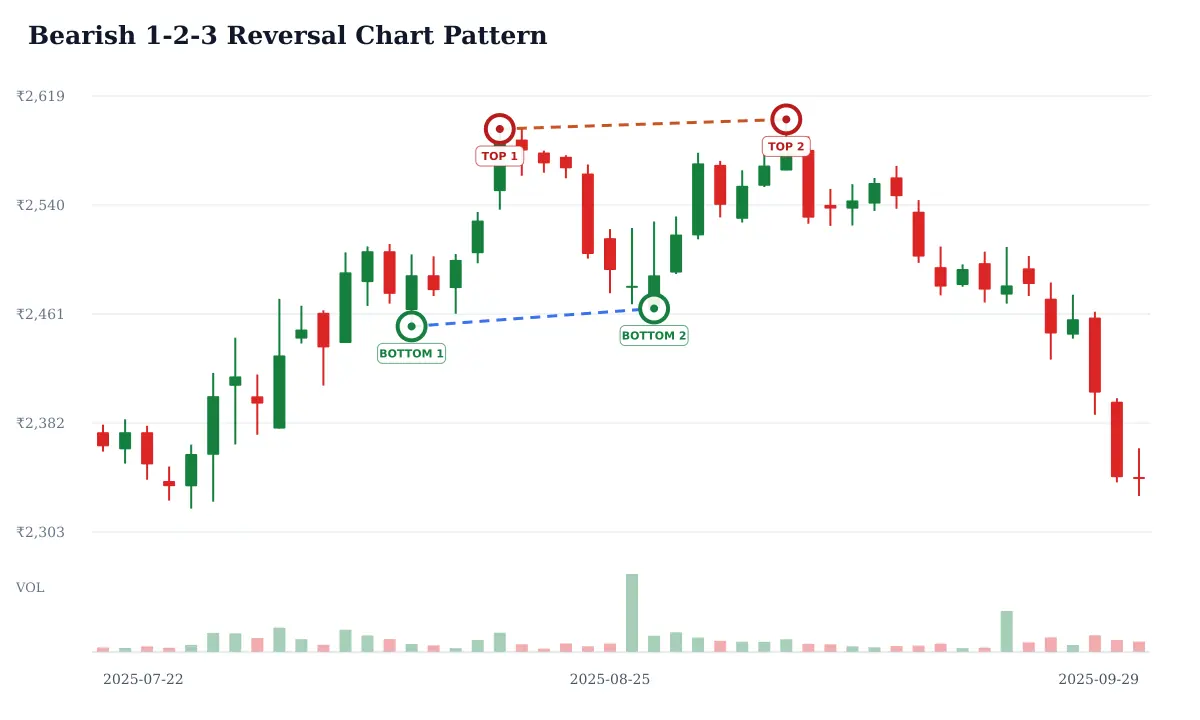
The bearish 1-2-3 reversal follows an advance: point 1 is a high, point 2 a pullback low, and point 3 a lower high. A close below point 2 is a common trigger. A new high above point 1 or a close above point 3 weakens the reversal idea.
Bullish Wolfe Wave Pattern
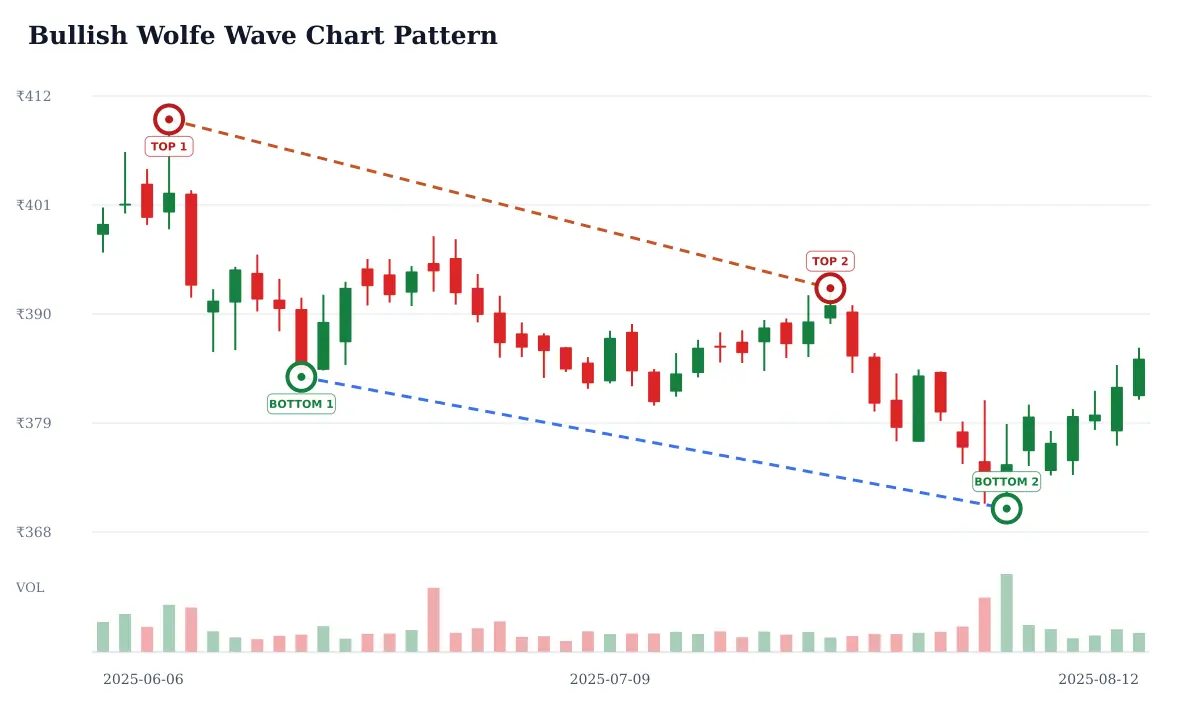
A bullish Wolfe Wave is usually drawn from five alternating pivots in a declining structure, with the fifth point extending beyond a boundary before a possible reversal. Point selection and target-line construction are subjective. Treat a move back into the structure as a candidate only; a continuing low invalidates the reversal thesis.
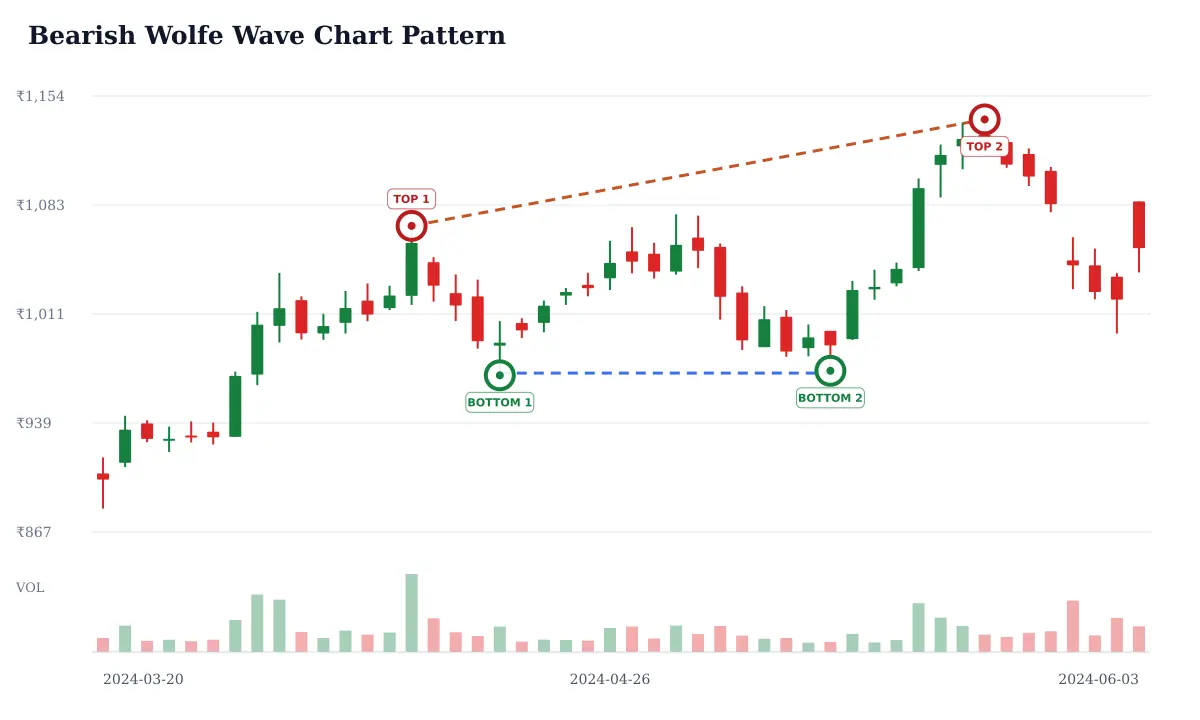
Bearish Wolfe Wave Pattern
A bearish Wolfe Wave is the upward mirror: alternating pivots rise, and the fifth point may overshoot before a possible decline toward a projected line. The geometry is not universally standardized. Look for rejection and a break back into the structure; a sustained new high defeats the setup.
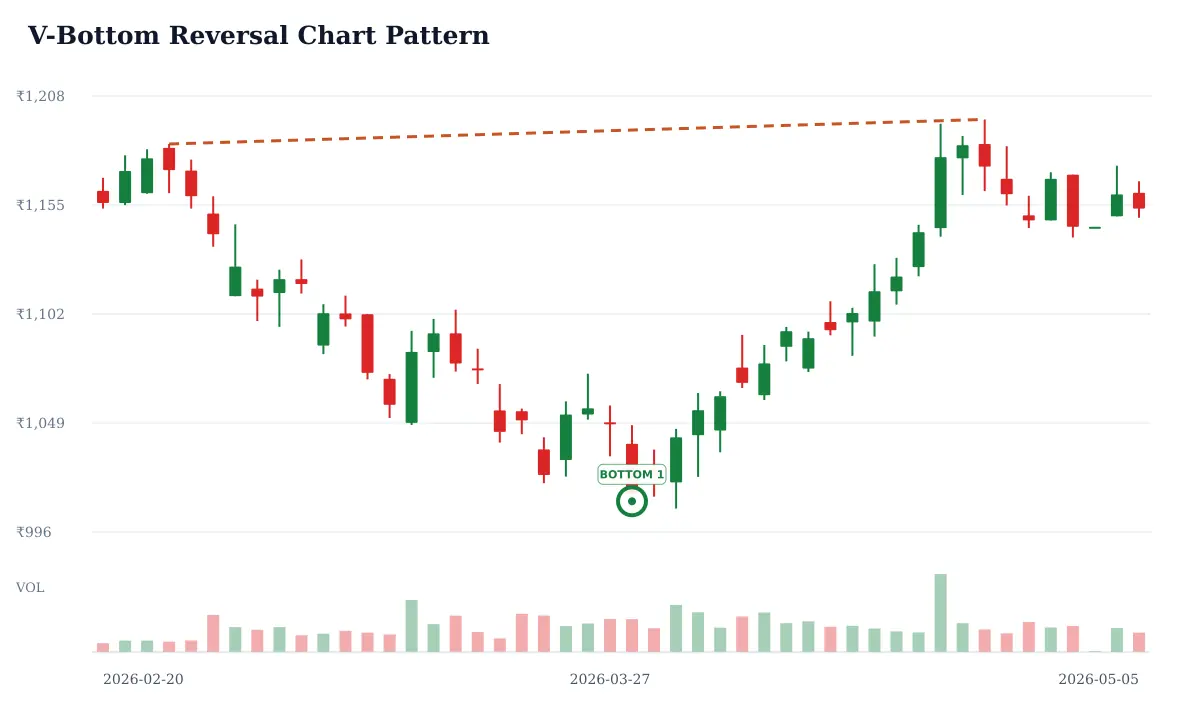
V-Bottom Reversal Pattern
A V-bottom is a rapid fall followed by a sharp rebound, with little or no rounded base. It can reflect a fast change in order flow but is difficult to identify in real time. A higher low or close through nearby resistance offers more evidence; a retest of the low exposes the reversal risk.
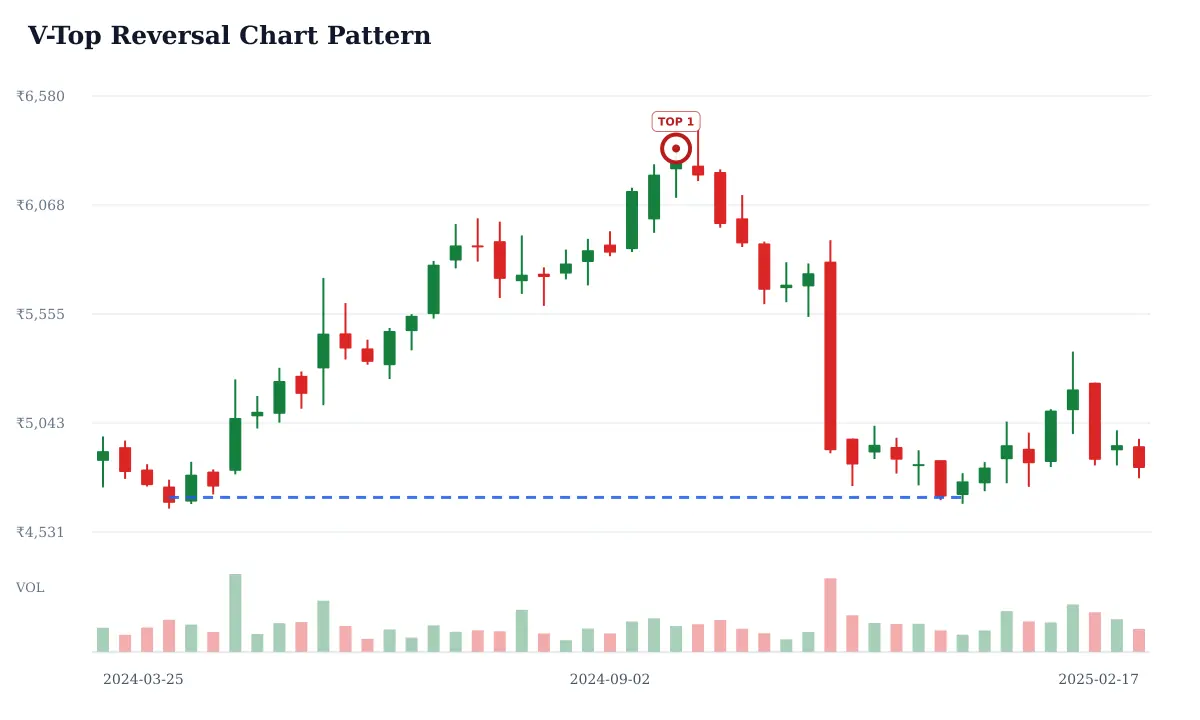
V-Top Reversal Pattern
A V-top is a rapid rise followed by an abrupt decline, forming a sharp peak rather than a gradual dome. The reversal is obvious only after the drop has begun, so hindsight can make it look easier than it was. A lower high or close below support adds evidence; a new high rejects the pattern.
How to Identify Chart Patterns
Start with the full chart rather than a cropped formation. Record the symbol, exchange, timeframe and data timestamp; identify the prior trend; then mark the actual swing points, boundaries, support and resistance. Compare like with like: use completed candles and consistent price adjustments, and avoid moving lines after seeing the outcome. On NSE shares, check liquidity and the date range as well as the shape.
How to Confirm a Chart Pattern
Choose a confirmation rule before evaluating the result. One common rule is a completed candle close beyond a neckline, trendline or range boundary; a retest that holds can add context, while a close back inside warns of a false break. Compare volume with an appropriate baseline and note the timeframe. Higher-timeframe structure can provide context, but it does not guarantee follow-through. Define the level that would invalidate the interpretation before drawing a conclusion.
Common Chart Pattern Mistakes
Common errors include labeling a pattern before its boundaries are clear, treating a wick as a confirmed breakout, using an incomplete candle, ignoring gaps or thin trading, and assuming that a textbook bullish or bearish bias is certain. Harmonic ratios and measured moves are conventions, not promises. A pattern can fail, a breakout can reverse, and delayed or adjusted data can change the appearance of a chart. Keep the observation separate from any personal trading decision.
Verification checklist
- Check the symbol, exchange, timeframe and delayed-data timestamp before interpreting a chart.
- Mark the actual support, resistance, neckline or trendline on the candles; do not rely on a pattern name alone.
- Wait for a completed candle beyond the relevant boundary and consider whether volume and market context support the move.
- Write down the invalidation level and maximum risk before considering any trade.
- Treat harmonic ratios and measured-move targets as conventions, not guarantees; test one consistent rule set on out-of-sample data.
- Do not treat these automatically selected historical candidates as verified examples, forecasts or investment advice.
Frequently Asked Questions About Chart Patterns
What are chart patterns in technical analysis?
They are recurring arrangements of price swings used to describe trend, consolidation or a possible change in market structure. They are analytical tools, not guarantees.
What are the most common stock chart patterns?
Common examples include head and shoulders, double top and bottom, triangles, flags, pennants, wedges, rectangles, cup and handle, channels and rounding formations.
What are reversal chart patterns?
They describe structures that may indicate an existing trend is weakening or changing. A reversal remains unconfirmed until price supports the interpretation, and it can fail.
What are continuation chart patterns?
They describe a pause or consolidation within a prior move. A break in the prior trend direction may support continuation, but the price can resolve the other way.
What are bullish chart patterns?
Bullish is a possible upward interpretation, often considered when price breaks resistance or forms higher lows. The label does not guarantee a rise or make a pattern suitable for every decision.
What are bearish chart patterns?
Bearish is a possible downward interpretation, often considered when price breaks support or forms lower highs. The pattern can fail, so confirmation and invalidation levels matter.
What is a double top pattern?
A double top has two peaks near a similar resistance area with a pullback low between them. A close below that intervening low is a common confirmation rule; matching highs alone are not enough.
What is a double bottom pattern?
A double bottom has two troughs near a similar support area and a reaction high between them. A close above that intervening high is a common confirmation clue, not a guarantee of follow-through.
What is a head and shoulders pattern?
It is a three-peak structure with a higher central peak, called the head, between two lower shoulders. The line through the reaction lows is the neckline; a close below it may confirm a bearish interpretation.
What is a cup and handle pattern?
It describes a rounded recovery toward an earlier high followed by a smaller pullback or pause near that level. A close above the rim is a possible breakout clue, while a deep handle can weaken the setup.
What are triangle chart patterns?
Triangles form as price swings converge. Ascending and descending triangles have one relatively flat boundary; symmetrical triangles have converging boundaries on both sides. Direction depends on the eventual break.
What are harmonic chart patterns?
Harmonic patterns use labeled price swings and Fibonacci ratio conventions to define a potential completion zone. Gartley, Bat, Butterfly, Crab, Cypher and Shark rules vary; a ratio match still needs a price response.
Can chart patterns predict stock prices?
No pattern can guarantee or precisely predict a future stock price. Patterns summarize past price behavior and can help frame scenarios, but false breaks, new information and changing conditions can invalidate them.
How can traders confirm a chart pattern?
Set a rule in advance, such as a completed candle close beyond a boundary. Review volume against a suitable baseline, the retest, timeframe, liquidity and nearby levels; also define what would invalidate the interpretation.
Are the NSE chart examples visually verified?
No. Most examples use historical, delayed NSE OHLC candles selected by a 48-session closing-path similarity search, not administrator visual review. Their labels are unverified educational candidates, not confirmed classifications or trading signals. The Double Bottom, Triple Top and Triple Bottom diagrams are illustrative schematics.
Research-only boundary
This content is for general information and independent research only. It is not investment advice, a recommendation, a solicitation, or a guarantee of any outcome. Market data may be delayed, incomplete or incorrect. Verify material facts with authoritative sources and consult a suitably qualified SEBI-registered professional for personal advice.
Continue your research
Browse the Knowledge Base · Learn how the platform handles research evidence
Related Technical Analysis Resources
- What Is a Candlestick Chart? — Review how candles represent price movement across a selected timeframe.
- Support and Resistance — Learn how reaction levels can provide context for a neckline or breakout boundary.
- Why Volume Matters — Understand participation and why volume needs a clear comparison baseline.
- RSI in Indian Stock Analysis — Use a momentum indicator as context rather than as a standalone pattern signal.
- Moving Averages — Read trend context and the limitations of lagging indicators.
- Technical Analysis — Read the broader guide to price, volume, indicators and confirmation.