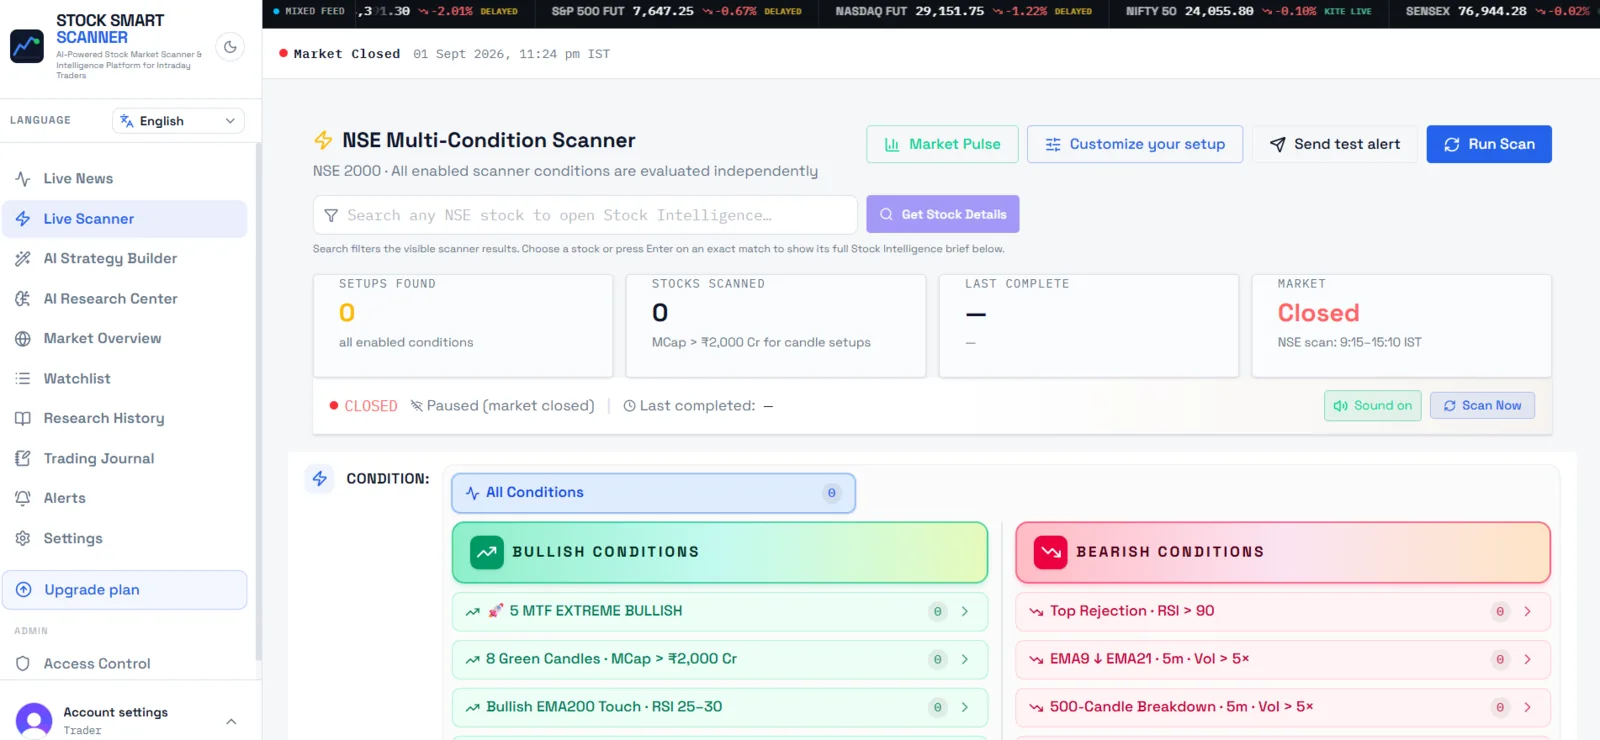
What is an intraday stock screener?
An intraday stock screener checks many stocks against a defined set of rules and returns the names that match. Instead of opening hundreds of charts one by one, a trader can begin with a specific question: which stocks are showing a particular price move, moving-average relationship, volume condition, or liquidity characteristic during a chosen session? The value is consistency. The same definition can be applied to a broad universe and reviewed with a timestamp.
A screener is different from a tip service. It does not know your capital, risk tolerance, execution quality, tax position, or suitability. A result is a prompt for the next research step. Stock Smart Scanner presents screening as informational market research and encourages independent checks of data freshness, company information, liquidity, and the wider market before a user makes any decision.
How the Live Scanner narrows a broad universe
The Live Scanner reduces the first-pass workload across an eligible Indian cash-market universe. Depending on the selected condition and available provider coverage, a scan can use price movement, EMA relationships, candle structure, relative volume, market capitalization, liquidity, and other measurable fields. Each condition should have a clear meaning. A price-above-EMA rule describes a relationship between price and a calculated average; it does not prove that momentum will continue.
A focused result list is easier to review than an unstructured watchlist, but it is still only a starting point. When several names match, compare the quality of the match. Look at the timestamp, candle timeframe, distance from nearby support or resistance, sector, index direction, and whether a news event explains the move. A short list makes better research possible; it does not remove the need for research.
Use technical conditions as questions, not predictions
Technical screening works best when the condition is written as a testable question. Is price holding above a short-term EMA after a completed candle? Is volume higher than a defined baseline? Has a stock moved through a prior range with enough participation to justify a closer look? Clear questions reduce hindsight because the same definition can be checked on another day. They also make it easier to identify when a result is unavailable rather than silently assuming that a missing value is zero.
EMA, volume, percentage change, and candle conditions describe different parts of market behavior. A moving average is a lagging summary of price. Volume can be distorted by a single print or corporate action. A breakout can fail at the next resistance level. The strongest research note records which conditions matched, which did not, and which inputs were unavailable. That evidence is more useful than a label such as bullish or strong without an explanation.
Why completed candles and timestamps matter
Intraday results can change while a candle is still forming. A price may move above a level and then close back below it. Volume may look unusually high halfway through a bar but become ordinary by the close. A responsible stock screener distinguishes completed candles from partial observations and shows when the underlying data was refreshed. The same condition can produce a different result at 10:15 AM and 2:45 PM.
Before comparing two scanner rows, check that they use the same timeframe, data window, and refresh context. If a provider is delayed, a required interval is not covered, or a symbol has incomplete history, the honest outcome is uncertain or unavailable. Treating stale data as current creates a false sense of precision. A timestamp is part of the evidence behind the result.
Add market and sector context before review
A stock can satisfy a technical condition because its entire sector is moving, because the broad index is reacting to an event, or because of a company-specific announcement. Market context helps explain which possibility deserves attention. Compare index direction, sector breadth, gainers and losers, and the timing of any relevant headline. A strong stock in a weak group may need a different research question from a stock rising with nearly every peer.
Context should narrow the next question rather than become another pile of unexamined indicators. If the scanner finds a volume breakout, inspect whether the move is broad or concentrated. If it finds a bearish EMA relationship, check whether the symbol is simply following a market-wide decline. The purpose of context is to prevent a single row from being interpreted as a complete thesis.
A practical intraday screening routine
Start by writing the condition and timeframe before opening the result list. Run the scan, note the refresh time, and remove rows with missing or clearly stale evidence. Group the remaining names by sector or market behavior. Open the chart for the few names that still answer your question and inspect the relevant candle, volume, VWAP, EMA, support, resistance, and broader index context. Then check whether a company event or official disclosure changes the interpretation.
Record what you found instead of relying on memory. A useful note includes the symbol, time, condition that matched, evidence that confirmed it, evidence that contradicted it, and the next fact that needs verification. This turns a stock screener into a repeatable research process. It also makes later review possible when the chart no longer looks as clear as it did during the session.
What a scanner cannot tell you
A screening result cannot guarantee direction, profit, execution, liquidity, or suitability. It does not account for every corporate announcement, trading halt, spread change, slippage event, fee, or personal constraint. Historical matches can also look attractive because rules were chosen after seeing the outcome. Use historical observations carefully and avoid presenting them as proof of future performance.
Stock Smart Scanner is built to organize evidence, not to replace judgment or professional advice. Verify material facts with primary sources and keep the limits of the data in the same note as the result. If a condition cannot be verified, do not fill the gap with a confident assumption. That boundary is essential for any intraday stock screener that aims to support responsible research.
Continue your research
- Intraday SetupTurn a scan into a defined setup question.
- Live NewsAdd company events and timestamps to scanner review.
- How to run a market scanRead the public scanner workflow guide.
Authoritative references
Use primary exchange and regulator sources to verify material claims.
- NSE India market dataCross-check important market observations with the exchange.
- SEBI InvestorReview official investor education and market-safety material.